|
Studies on the Development and Organisation of the Nervous System of Caenorhabditis elegans
Part II - The Organisation of the Adult Nerve Ring
see also: Part I - The Outgrowth of Nerve Processes in the Embryo
Richard Michael Durbin
Thesis published 1987
Preface -
Summary -
Part I - Part II - Appendix - Conclusion - References - PDF
Preface
April, 1987
The work described in this dissertation was carried out between January 1984 and March 1987 at the MRC Laboratory of Molecular Biology, Cambridge. As described in the summary, two different approaches were used in this work, and the main body of the dissertation is split into two parts, each with its own introduction. However the introduction to the first part provides much of the general background. There is a final conclusion which considers both parts in a broader setting.
It is customary to list a long series of acknowledgements somewhere in the preface to a dissertation. I have derived enormous personal and scientific benefit from my time spent at the Laboratory of Molecular Biology, both from the people who work here and the environment that they have created. I am only going to thank personally two people, my supervisor John White, to whom I owe so much that it would be pointless to try to encapsulate it, and Nichol Thomson, who does all the serial sectioning of C. elegans at the MRC with remarkable consistency, and ultimately without whom none of this work would have been possible. I would also like to thank the Medical Research Council for a Training Award, and King’s College for a Research Fellowship.
With the exception of the technical serial sectioning for the first part, this dissertation is the result of my own work and includes nothing which is the outcome of work done in collaboration. No part of this dissertation has been or is being submitted to any other University.
May 18, 2001
This thesis was written in 1987 and has not been updated since. The discussion of related literature is therefore severely out of date. It is being made available because it provides the primary source for quite a lot of material that was not published elsewhere, in particular concerning the early outgrowth of neurons in the ventral and dorsal cords.
Part II - The Organisation of the Adult Nerve Ring
Chapter 6: Introduction and Methods
1. Introduction
2. Methods
Chapter 7: Materials and Methods
1. Synaptic distributions
2. Adjacency and synapse formation
3. Reciprocal synapses and join chemical/electrical connections
4. Connections between members of the same neuronal class
5. Reproducibility of connections
6. Reproducibility depends on the number of synapses made, not on adjacency
7. Mismatches of chemical synapses are due to extra connections more often than to missing connections
8. Connections are not determined purely by neuronal classes
9. Differences between repeats of equivalent circuitry
10. Connection formation and adjacency
11. An underlying pattern of connectivity with additions?
12. Localisation of synaptic specificity within neurons
13. Conclusion
Chapter 8: The Logical Organisation of the Circuitry
1. Directionality
2. The organisation of the feedback
3. The processing depth
4. Discussion
Chapter 9: Process Placement in the Nerve Ring
1. Specific persistent contacts
2. Identified bundles
3. Discussion
Appendix
A.1 The statistical test for synapse number correlation with adjacency
A.2 The sorting algorithm used to order the neural circuitry
A.3 The method used to determine processing depth
A.4 The clustering algorithm used to detect bundles
Conclusion
Chapter 6: Introduction and Methods
6.1 Introduction
6.2 Methods
6.1 Introduction
Around the beginning of this century several attempts were made to map all the nerve processes in a nematode nervous system, using light microscopy of methylene blue stained animals, most notably by Goldschmidt (1908), who argued erroneously that a nervous system was a syncytial network of anastomatosed cells. That view was soon disproved, but it was not until recently that the goal was realised of determining the anatomical structure of a complete nervous system at the level of individual processes and synaptic connections (White et al., 1986). As part of that achievement the entire central nervous system of two C. elegans specimens was reconstructed from electron micrographs of serial sections. The purpose of the investigation reported here was to extract information about the organisational structure of the C. elegans nervous system from the resulting anatomical data, concentrating in particular on the synaptic circuitry.
The approach taken was to construct a computer database containing information about all the synapses and gap junctions between the neurons, and also form one animal an indication of the amount of contact between each pair of neurons. This information was used for three separate lines of investigation. The first was to study the distribution of synapses within the nervous system in order to investigate the variability of the circuitry in different circumstances, and the type of variation seen, and to use that variability to make inferences about possible factors involved in determining whether connections are made. This work is described in Chapter 7. The second line of study, described in Chapter 8, considered the general organisational structure of the synaptic circuitry, and how it might relate to function. The third, described in Chapter 9, used the data on the contact between neurons to investigate the physical organisation of nerve processes in the neuropil.
The date for all these investigations are purely anatomical; there are no physiological studies on the nerve ring neurons in either C. elegans or Ascaris. Some of the functional circuitry involved in the motion response to a touch stimulus in C. elegans has been deduced by a combination of laser ablation experiments and the detailed anatomy (Chalfie et al., 1986). However practically all of the discussion concerning possible function of parts of the ring circuitry has to be based on the electron microscope anatomical data showing sensory endings, synapses and gap junctions, and motor output onto muscle. As will be shown in Chapter 8, there are some fairly broad statements that can be made about the organisation of connections at the level of the whole nervous system, or groups of neuronal classes, but caution must be exercised in interpreting plausible connectivity patterns in any detail. In particular no attempt is made to predict the inhibitory or excitatory nature of particular synaptic connections, or to stimulate, even conceptually, any piece of circuitry.
The type of study undertaken here is novel because the data available are unique in their completeness at such a fine level of detail. There have been many studies of circuitry at the physiological level in other animals (research on a number of well defined invertebrate systems is reviewed in Selverston, 1985) and it is often possible to dye fill the neurons from which recordings have been made to determine their anatomy at the light microscope level. However the overall distribution of connectivity between all the different identified neurons in even a part of a central nervous system has not previously been analysed at an electron microscopic level, owing largely to the much greater complexity of other animals' nervous tissue. Perhaps the system about which most is known is the vertebrate retina, which has been studied in detail at both a physiological and electron microscope level (Dowling and Boycott, 1966, McGuire et al., 1986, reviewed in Sterling, 1983). Around 50 types of cell falling into a few basic classes have been identified, and much is known about typical connections between these cell types. However particular cells and situations are not reproducible and electron microscope studies have necessarily concentrated on the properties of single cells (McGuire et al., 1986).
6.2 Methods
Data from two electron microscope reconstructions, the H series and the U series of White et al. (1986), were used to construct a computer database. The part of the animal that is represented in the database is the whole of the central processing region, or nerve ring, which consists of a ring of neuropil around the pharynx in the head of the animal that contains about 175 nerve fibres and the vast majority of the synapses in the entire nervous system. A general description of the C. elegans nervous system can be found in Chapter 1. Chapter 2 introduces the nomenclature of C. elegans neurons. The database contains the following information about the nerve processes in the ring: for each pair of neurons it stores the number of gap junctions between them and the number of chemical synapses in each direction. In addition, for the H series, there is a measure of the adjacency or degree of mutual contact between each pair of processes. This adjacency was obtained by looking at every 5th micrograph in the reconstruction series and counting the number of these pictures on which the given pair of neurons were in contact.
The word synapse is reserved for chemical synapses in this discussion; electrical connections are referred to as gap junctions because they are identified as such from the electron micrographs. White et al. (1986) presents the criteria used in identifying synapses and gap junctions in C. elegans electron microscope reconstructions. Synapses are made en passant between adjacent processes. Although synaptic boutons are not seen, synapses can be recognised in electron micrographs by the presence of presynaptic density and the accumulation of vesicles. The chemical synapse count in the database combines data from monadic and dyadic synapses. In dyadic synapses, which are seen frequently in C. elegans, there are two postsynaptic partners. It excludes cases where the only connection seen between two cells is half a dyadic synapse, since such observations have been seen to be unreliable.
In general throughout the presentation and discussion of results a distinction is made between a connection between two neurons, and a synapse between them. There is a connection if there are one or more synapses. All the results that do not concern comparison between the two different animals represented in the H and U series were obtained with data from the H series alone, because the adjacency information, which is only available for that animal, is often an important factor in the analysis. For a general H series neuron, A, I will refer to its contralateral homologue as A', and to the corresponding in the U series as Au.
The database program is written in C and implemented on a VAX-8600 minicomputer. The main data is stored in a large array in virtual memory, together with a set of referencing arrays that allow easy access and cross comparison. All the analysis software is contained in one program that is modular in design and uses a free format command input system developed previously (Durbin et al., 1986). An analysis requiring a new algorithm is implemented by writing a new subprogram and entering it as an option in the command tree.
This investigation relies on much previous hard work by Nichol Thomson, Eileen Southgate, and John White in performing the original reconstructions, and crosschecking all the data. I would also like to thank Barbara Cross and Mabel Eggo for assisting in typing some of the data into the computer.
Chapter 7: Synaptic Distributions and Reproducibility
7.1. Synaptic distributions
7.2. Adjacency and synapse formation
7.3. Reciprocal synapses and join chemical/electrical connections
7.4. Connections between members of the same neuronal class
7.5. Reproducibility of connections
7.6. Reproducibility depends on the number of synapses made, not on adjacency
7.7. Mismatches of chemical synapses are due to extra connections more often than to missing connections
7.8. Connections are not determined purely by neuronal classes
7.8.1 Discussion
7.9. Differences between repeats of equivalent circuitry
7.10. Connection formation and adjacency
7.11. An underlying pattern of connectivity with additions?
7.12. Localisation of synaptic specificity within neurons
7.13. Conclusion
7.1 Synaptic distributions
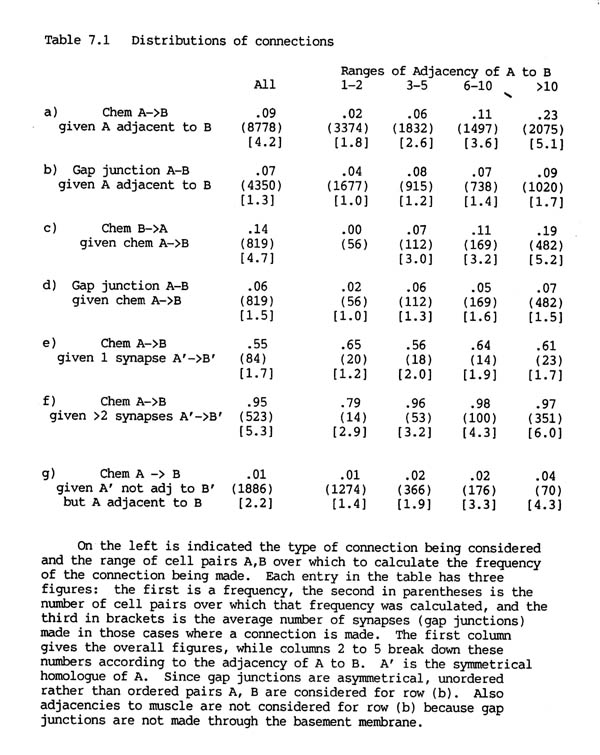
Altogether there are 3462 chemical synapses and 754 gap junctions between the 183 neurons in the H series database. The two different types of connection, gap junctions and chemical synapses, are distributed rather differently in the nervous system, as can be seen from table 7.1. Table 7.1 rows a) and b) show the proportion of pairs of adjacent processes that are connected by chemical synapses or by gap junctions.
Although there are 4.5 times as many chemical synapses as gap junctions, the proportion of pairs of adjacent cells connected by chemical synapses is similar to that connected by gap junctions (9% and 7% respectively). This is because a pair of cells is often connected by several chemical synapses, but rarely by more than one or two gap junctions. In other organisms there may be hundreds or thousands of synapses between a given pair of neurons (e.g. a cerebellar basket cell make many synapses on a Purkinje cell). The small number of synapses in C. elegans is probably due to the extremely small size of the entire nervous system.
 TABLE 7.1. Distributions of connections
7.2 Adjacency and synapse formation
It is immediately obvious from table 7.1 (rows a, b) that both the probability of being connected by a chemical synapse, and the number of synapses actually formed, are highly correlated with adjacency. There is a 14 fold increase in the proportion of connections formed when pairs of cells that have a high adjacency are compared with pairs that touch only briefly. This correlation is far less marked for gap junctions, for which the corresponding increase is only a factor of two. While the vast majority of chemical synapses are between pairs of cells with adjacency greater than 10, nearly half the gap junctions are between cells with adjacency less than or equal to 5.
It might be thought that the increase in the average number of synapses formed with higher adjacencies provides evidence that synapse formation is dependant on the area of contact. However, for any given pair of neurons it is possible to show that the number of synapses made between them does not substantially change with their adjacency. This proposal can be tested by considering pairs A, B which have contralateral homologues A', B'. In general A', B' will have a different adjacency from that of A, B, and they will often also form a different number of synapses. If we assume that the synaptic formation mechanisms for symmetrical pairs on the two sides are equivalent then we can test statistically whether the number of synapses formed tends to vary proportionally with the adjacency, or remains independent of adjacency. The details of the test are given in the appendix, but the results are as follows. There were 391 pairs of processes which formed synapses on both sides and showed different adjacencies on the two sides, and the value of the test statistic was 7103 with an expected standard error of around 1330. If the number of synapses varied proportionally with adjacency then the value should ideally be 0, while if it was independent the value should be around 7655. It is clearly many standard error values from 0, and only about half a standard error distance from 7655. Therefore there is strong evidence against a proportional system, and the data are consistent with the number of synapses between a given pair of neurons being determined independently of the adjacency. The slightly lower value of the calculated test statistic than that expected by a wholly independent model can be explained by the fact that there must be some effect at very low adjacencies. If the adjacency is 0 then clearly no synapses can be made, and when it is only 1 or 2 there are spatial limitations preventing a large number of synapses being formed.
7.3 Reciprocal synapses and joint chemical/ electrical connections
It is important to consider the correlation between synapse formation and adjacency when looking for statistical interactions between the different types of synapse. For instance, the frequency of reciprocal chemical synapses is consistent with synapses being independently specified in each direction. Although the overall probability of a connection from neuron B to neuron A given one from A to B is high (14% as opposed to 9%, see table 7.1 row c), this is because most of the pairs with a synapse from A to B have high adjacency, and so are more likely than normal to have a reverse synapse from B to A. When the probability of a reverse synapse is shown separately for each adjacency range, as in table 7.1, it can be seen to be essentially the same, or possibly slightly lower, as that for an unconditional synapse.
The same approach can be used to consider whether there is any statistical interaction between chemical synapses and gap junctions. In this case there is a slight negative correlation, since the probability of a gap junction between a pair of cells that are linked by chemical synapses is reduced by 1 or 2 percent from the unconditional probability in each adjacency range (table 7.1 row d). This difference can be partly explained by the fact that a significant proportion (66/284) of gap junctional connections are between members of the same neuronal class, while it is rare for there to be intraclass chemical synapses (discussed below).
Therefore the presence of one type of connection between cells does not provide any indication of whether another type, either gap junctional or chemical in the opposite direction, will also be present. The only exception to this is when the cells are members of the same class, in which case if there are chemical synapses (only 5 examples) then they tend to be reciprocal (4/5), as would be expected. Together with the overall dependence of synapse formation on adjacency these results mean that there is a remarkably high probability of some form of connection between processes that have a high adjacency. If the adjacency is greater than 10 then the proportion of pairs forming either a gap junction or a chemical synapse one way or the other is 47% (478/1020).
7.4 Connections between members of the same neuronal class
Gap junctions are far more frequent than normal when both cells are members of the same neuronal class. The 302 neurons in C. elegans have been put into 118 different classes on the base of similar morphology and connectivity (White et al., 1986). Many of these classes, particularly those with processes in the nerve ring, consist of a pair of bilateral, symmetry related neurons. There are 61 such pairs in which the two cells make physical contact and 35 (57%) of these have gap junctions while only 5 (8%) have chemical synapses.
It is common for there to be a gap junction where the ends of two processes from different members of the same neuronal class abut, such as when left and right symmetry related processes meet at the top of the nerve ring. This abuttal is interesting in itself, since it suggests that the processes might stop growing when they establish contact with the tips of their contralateral homologues. A similar phenomenon is seen in the ventral and dorsal nerve cords, where the processes from consecutive neurons of two classes of motor neuron (VD and DD) abut and make gap junctions but do not overlap; the other classes overlap (except AS), and sometimes make gap junctions. In the ring there are 24 pairs of cells whose processes end where they meet at the dorsal midline, and a gap junction is present in 22 of these cases. Of the 37 other classes of cells that have interclass cell contacts, but which do not abut, only 13 interclass gap junctions. None of the pairs that form internal chemical synapses abut, nor do any of interneurons that send adjacent processes back along the ventral cord; perhaps if they had inhibited each other's growth they could not have grown out together along the cord.
7.5 Reproducibility of connections
There are two sources of synaptic reproducibility that might be expected in the database. The first is from animal to animal, and the second is due to internal bilateral symmetry within one animal. Most neuronal classes that are associated with the nerve ring, and so represented in the database, consist of one or more bilateral pairs of homologous neurons. One problem with the comparison between animals is that the U series animal was an adult, while the H series animal was an L4 larva. Although almost all neural development in the nerve ring is embryonic the sex-specific circuitry concerned with egg laying is incomplete in the H series, and there may be other less obvious differences due to age.
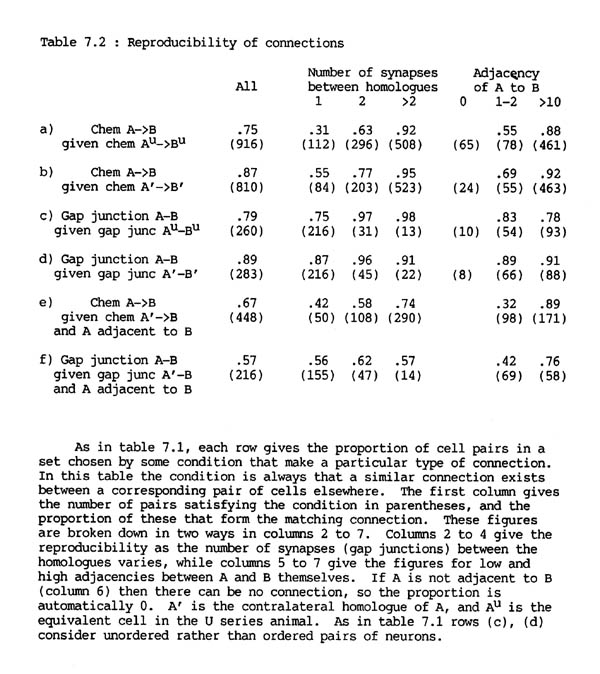
The probability that a given pair of H series neurons A, B will be connected by chemical synapses if their contralateral homologues !' and B' are connected is 87%, while the probability that they will be connected if their U series homologues Au and Bu are connected is only 75% (table 7.2 rows a, b). The corresponding figures for gap junctions are 89% and 79% (table 7.2 rows c, d). It therefore appears that gap junctional connections are slightly more reproducible than synaptic ones and that the two sides of the same animal are more similar than the two different animals. Part of the difference in chemical synaptic connectivity between the two animals is that there are more chemical synapse connections in the U series than the H series (916 as opposed to 819), and the extra connections are certain to be unmatched. However the difference between the animals is still probably significant because there are fewer U series gap junction connections than ones in the H series (260 against 284) but a lower proportion of U series gap junctions are matched in the H series than ones of the opposite side of the H series (above).
The difference between the "within animals" (left/right) comparison and the "between animals" (H/U) comparison can be further illustrated by considering the pairs that form connections in only two of the four possible places (each side of each animal). There are six ways that this can happen: both sides of the H series but not at all in the U series, both sides of the U series but not in the H series, and four different ways that there could be one synapse in the U series and one in the H series. If the similarity between animals were the same as that between sides of the same animal then the size of all these classes should be the same: the number of pairs synapsing only in the H series, and the number synapsing only in the U series, should be a quarter of the number that synapse just once in the H series and once in the U series. In fact there are 23 pairs that synapse only in the H series, 51 only in the U series, and 64 that synapse once in each series. For gap junctions these numbers are 41, 22 and 14. In both cases there are more connections than expected that are U series specific or H series specific, indicating that there are significant differences between the two animals.
Similarly, a test can be performed to detect whether there is also a reproducible difference between the right and left sides of the nerve ring. If there was such a difference then one would expect that the connection between a pair of Au,Bu in the U series would resemble more closely that between their exact equivalents in the H series, A,B, than that between the corresponding cells on the contralateral side, A' and B'. In fact the figures are 75% reproducibility to A,B, 74% to A'B' for chemical synapses, and 79% to A,B, 77% to A',B' for gap junctions. Therefore if there is consistent difference between the two sides it is very slight (1 or 2%). It would not be possible to identify the source of any consistent difference that may be reflected in this small change of reproducibility, because there is too much noise from the difference between the two animals.
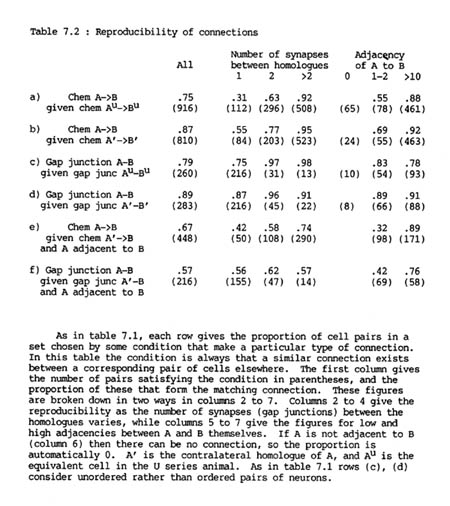 TABLE 7.2. Reproducibility of connections
7.6 Reproducibility depends on the number of synapses made, not on adjacency
Overall the observed levels of reproducibility suggest that there is an underlying regular pattern. In particular the two sides of the same animal appear to be sufficiently similar to allow us to assume that they were subject to the same synaptic specification procedure during development. This allows us to consider some aspects of the question of how neural connectivity is determined. By identifying the sources of inaccuracy of synaptic reproducibility it is possible to obtain information about, and thus to make suggestions about, the mechanisms for establishment of specific circuitry. This approach has already been used to indicate the independence of the number of synapses made between a pair of neurons from their adjacency. All the effects we will consider would not be altered significantly by one or two percent change due to possible slight genuine differences between the two sides.
Although it appeared at first sight that there was an unexpectedly high variation in the formation of chemical synapses, almost all the inconsistencies are due to the unreliability of weak connections, i.e. connections with only a small number of synapses. For pairs connected by three or more synapses (which is true for about two thirds of connected pairs) the probability that their homologues are connected is greater than 90%, whereas if there is only a single synapse then the probability that their homologues will be connected is only around a half. This difference exists both between and within animals (for exact numbers see table 7.2).
Clearly one cause of a mismatch in which a connection seen is present on one side but missing on the other might be that the neurons are not in contact in the case where the synapse is missing. However if they do touch each other then the dependence of reproducibility on the number of synapses made is practically independent of adjacency. If we consider A, B such that A' and B' are connected by only one synapse then the probability of connection between A and B is around 60% in all adjacency ranges. At the other extreme if A' and B' are connected by three or more synapses then the probability that A and B are connected is 79% (11/14) if their adjacency is one or two, and more than 95% in any adjacency range greater than two (table 7.1 rows e, f). It is necessary to consider the data this way, because a direct comparison of reproducibility at different adjacencies would suggest that adjacency is an important factor (table 7.2 rows a, b, final columns). In fact this effect is mostly secondary, caused by the fact that connections with higher adjacency tend to have a larger number of synapses. If we combine this result with the earlier observation that the number of synapses made between a given pair of neurons is essentially independent of adjacency, then it appears that, except at very low adjacencies, the probability that two given processes will form a synapse is also practically independent of their adjacency. The overall correlation between synapse formation and adjacency (Table 1, row a) therefore implies that the physical organisation of processes is such that neurons that reproducibly synapse tend to have higher adjacencies. This is considered further in the discussion.
The picture that emerges is that pairs of neurons are programmed to make an approximately predetermined number of synapses, and that the connection will be more reliable if this number is greater than one or two. There is no significant similar set of results for gap junctions, because, as far as numbers of junctions are concerned, more than three quarters of gap junctional connections involve only one gap junction, and as regards adjacency, there is very little correlation between the presence of gap junctions and adjacency. It is however true that in the cases where there are two or more gap junctions on one side the chance of there being at least one on the other side is higher than normal (94%).
7.7 Mismatches of chemical synapses are due to extra connections more often than to missing connections
If we assume that there is an underlying "normal" pattern of connectivity then there are essentially two ways that a mismatch can occur. Either an additional abnormal connection can be made, or a normal connection can be missing. For any given connection involving a bilaterally represented neuronal class there are four equivalent possible locations that the connection could occur in the database, one on each side of each animal. If a mismatch exists in one animal then one can look in the other animal to get some idea of whether the connection is normally there or not. For chemical synapses there are over four times as many connections that occur in only one of the four cases as in three out of four cases (137 and 32 respectively). This implies that four times as many mismatches are due to a single extra connection being present as are due to a single connection being missing. The same is not true of gap junctional connections, for which there are 74 present in only one case and 58 in three cases.
These observations concerning unmatched chemical synaptic connections suggest that there are a set of extra synapses in addition to a fairly consistent set of basic connections. We can attempt to estimate the consistent set of synapses by counting only those synapses in addition to a fairly consistent set of basic connections. We can attempt to estimate the consistent set of synapses by counting only those synapses that are seen in three or four of the possible cases (both cases if both members of the pair of neurons are unique). There are 2890 of these synapses per animal, leaving 1184 extra synapses altogether in both animals, associated with 647 different cell pair types. Some of these synapses are between cells that are already connected by consistent synapses. However less than half (498) fall into this class; those that do so add fairly evenly to consistent connections with both more and fewer consistent synapses. The remainder (686) are formed between pairs that are not consistently connected. There is a tendency for these to be between processes that have higher adjacency; 437 are between processes with average adjacency 6 or greater.
White (1983) suggested that mismatches might arise because synaptic connections were only specified between processes that are normally adjacent, so that if a nerve process was misplaced and acquired new unexpected neighbours it might make additional, incorrect connections to some of them. There is quite a large variation in the set of cells contacted by any neuron, since if A is adjacent to B then the probability of A' being adjacent to B' is only about 75% (7028/9214). However this is not the predominant source of mismatches. If A' is not adjacent to B' the probability of a connection from A to B is far smaller than normal (table 7.1 row g compared to row a). Only about a quarter of all mismatches can be explained in this fashion (24/108 for the bilateral comparison and 65/224 for the H/U comparison - 5th column of table 7.2). The proportions are similar for gap junctions (8/32 and 10/55 respectively). These results suggest first that specificity is probably determined for at least an extension of the normal set of neighbours, covering processes with which a neuron is likely to stray into contact, and second that physical contact is not a major limiting factor in determining synapse formation, since most of the marginal synapses are made with processes with which the neuron is normally in contact. Instead the earlier observations suggest that additional synapses are mostly made between processes that normally have reasonable adjacency.
7.8 Connections are not determined purely by neuronal classes
So far we have compared pairs of neurons that are directly symmetry related, such as A, B to A' B'. There are also many situations where a neuron B contacts both A and its contralateral homologue A'. These contacts are not symmetry related, but if connections are determined purely by the classes of the two neurons, then one would expect a connection between A and B whenever there was one between A' and B. In fact the overall measures of this type of reproducibility are 67% for chemical synapses and 57% for gap junctions (table 7.2 rows e and f respectively), significantly less than the levels of reproducibility for symmetry related connections (rows a, c). The given frequencies of a matching connection from A to B are conditional on A and B being adjacent, since there is no automatic reason why A and B should be adjacent whenever A' and B are, because there is no geometrical symmetry relating to the two pairs. This difference is due neither to the number of connections from A’ to B tending to be low nor to the adjacency of A and B being low, since there is still a difference when the frequency is tabulated with respect to either of these categories (columns 2 and 6 of table 2). Indeed the reproducibility is down to 70% even in the cases where there are 3 or more synapses, which are 95% reproducible in the symmetric left/right comparison. The only set of conditions under which there is a respectable degree of reproducibility is when the adjacency of A to B is high (column 7).
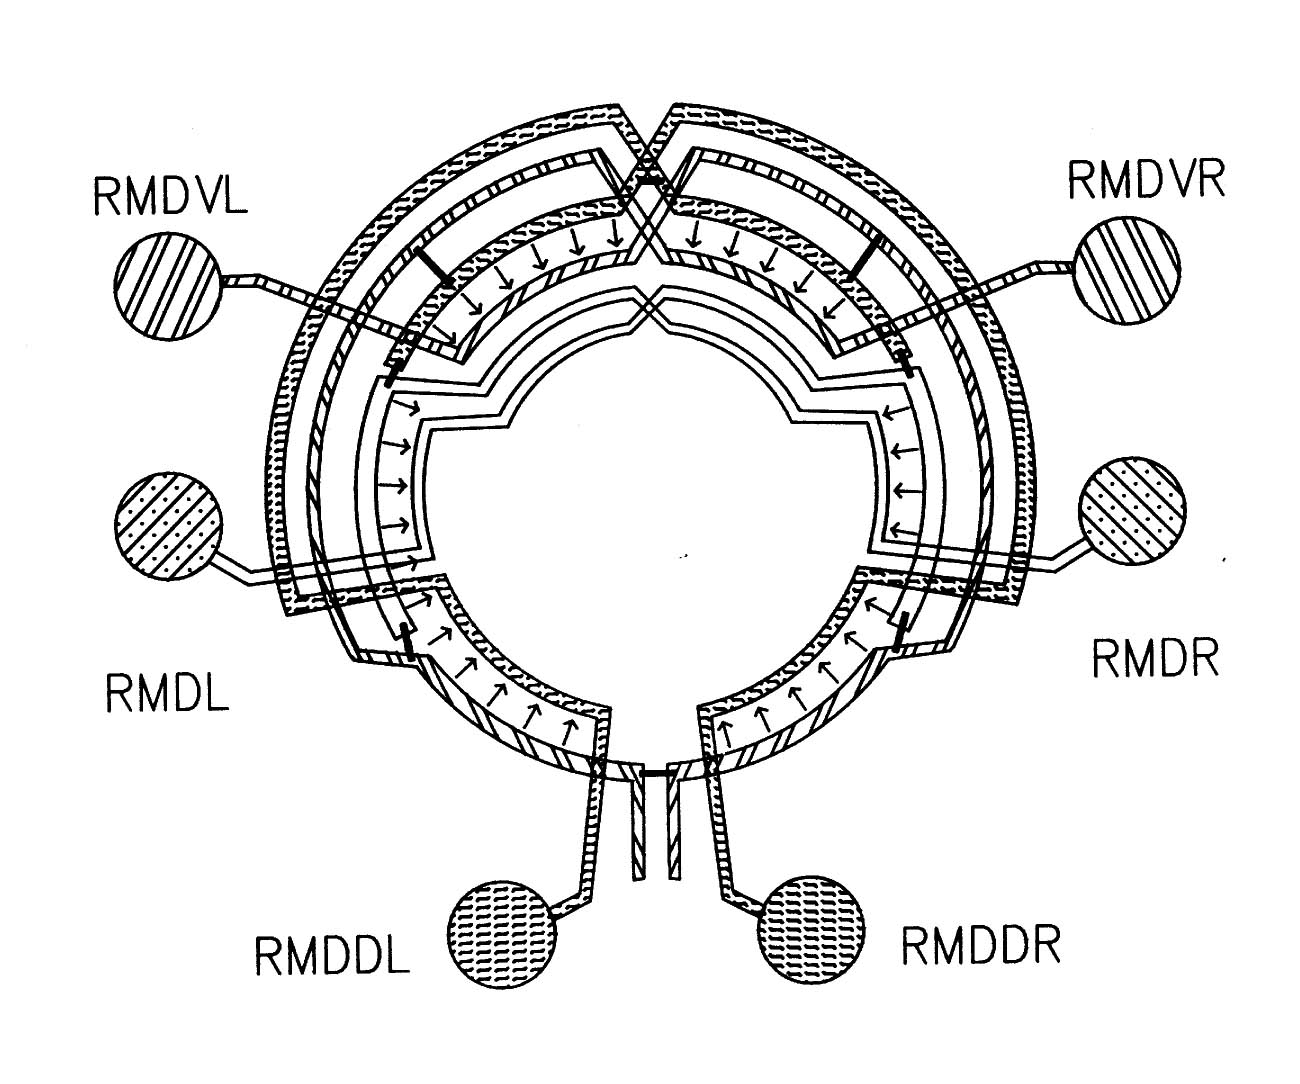
What might cause the difference between A and A' in synaptic specificity with respect to B? If the difference is cell intrinsic, as opposed to being activity related, then either A and A' must be inherently distinguishable or else either they or B must be regionally specialised. Regional specialisation would account for the observations because in general different parts of A and A' contact B, and they contact it in different places (see figure 7.1 for an example concerning cells all of the same class). There are several indications that suggest that this might be a correct explanation. Although few neurons in the C. elegans nerve ring have a classical bipolar morphology, with a presynaptic dendritic structure and a predominantly postsynaptic axonal structure, there are many neurons whose processes show regional differences (White et al., 1983, White et al., 1986), and most of the cases of differential specificity that we are considering, such as that between the RMD neurons shown in figure 7.1, involve these cells. In addition, if the differences were due to regional specialisation, then there would be the highest chance of a mismatch if the cells only touched in one place, and much less chance if they were in contact over a large proportion of their axonal structure. This suggests that the mismatch frequency would be lower when the adjacency of A and B was high, which is indeed the case (table 7.2 column 7). Such an effect would not be expected if the difference between A'B and AB synapses was due to distinct identificatory labelling of A and A'.
Similar results are obtained when comparing synaptic specificity of dorsal and ventral members of the same neuronal class. Once again their interactions with other neurons are not symmetry related, and so the lower levels of reproducibility that are observed (69% for chemical synapses and 52% for gap junctions) can be explained by regional specialisation of some of the neurons.
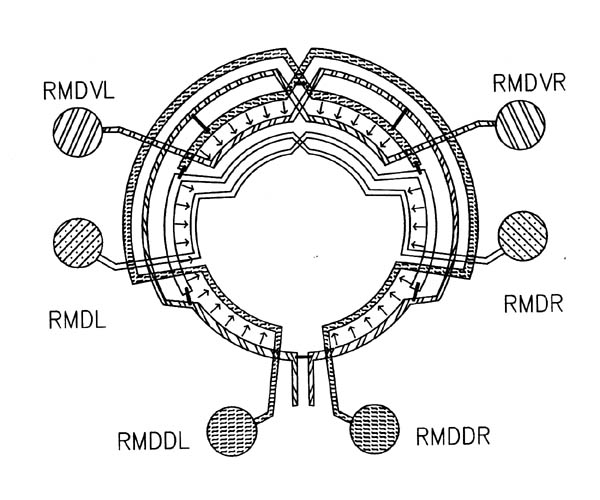 FIGURE 7.1. A schematic diagram showing the interconnections between the 6 members of the RMD class of neurons. The circle represents the nerve ring. At each radial position around the ring one of the RMD neurons has synaptic output (arrows), both onto muscle and onto other neurons, including the diametrically opposite RMD neuron, which intercepts the neuromuscular junctions (as with the DD process in figure 3.6). In general the RMD neurons are monopolar, with their proximal regions showing this intercepting behaviour, and their distal regions being synaptically active. Gap junctions (thin bars) link neighbouring neuromuscular regions but are not formed in general even where processes are close, such as for instance where chemical synapses are made. Some variability was seen in this general pattern, since in the U series RMDL had output (both to muscle and other neurons) from the proximal as well as the distal part of its process).
7.8.1 Discussion
The main conclusions of this set of investigations are:
1. The overall pattern of connectivity between neurons is fairly reproducible. However at a detailed level there are differences. There is a greater difference between the two animals than between the two sides of one animal.
2. Although chemical synapse formation is correlated with adjacency when all pairs of neurons are considered, between any particular pair both the probability of forming a connection, and the number of synapses made, are essentially independent of adjacency.
3. Synaptic reproducibility is very high (over 95%) if several synapses are normally made. However there is a substantial number of unmatched single synapses, present in only one of two symmetrical cases. A significant majority of unmatched chemical synapses appear to be due to the formation of abnormal or infrequently made connections, rather than the loss of a normal connection.
4. The formation of a connection between two neurons is not purely dependent on the classes of the neurons involved and whether they are adjacent. A possible additional factor is that in many cases synaptic specificity is regionally localised on neurons.
I shall discuss these points in turn.
7.9 Differences between repeats of equivalent circuitry
There are two significant questions concerning the overall reproducibility of the synaptic connections in the nerve ring. The first is whether the differences seen are systematic and functional, or merely random variation due to looking at an essentially fixed pattern at too fine a level of detail. The second is whether the left and right sides of the nerve ring are developmentally equivalent in terms of synaptic circuitry. Some parts of the nervous system show significant reproducible left/right asymmetry (e.g. the ventral nerve cord, see Chapter 5), but at a gross level the two sides of the ring are symmetrical. These questions could be addressed by considering the four examples of each cell pair interaction present in the database, one for each side of each animal.
To consider the second question first, a comparison was made to search for consistent synaptic differences between the left and right sides across the two animals. This indicated that they were very similar, although there may be a slightly greater similarity overall between the same sides of the two animals than between their opposite sides (approximately 1%, the effect for instance of a single possible asymmetric neuron class). This possible minor difference was ignored for the rest of the analysis in order to consider the two sides as developmentally equivalent when investigating their differences. There was a certain amount of unsystematic variation between the two sides. Clearly it is not easy to assess the functional significance of anatomical changes in synaptic connectivity in a circuit whose function is largely unknown. However there was no obvious observable pattern to the differences that might have suggested a rewiring of any piece of the circuitry, such as loss of one connection but a gain of a compensating connection to a parallel interneuron, and the vast majority of differences involved connections with just one or two synapses, or a single gap junction. It seems reasonable to suggest that the variation seen here is mostly due to random fluctuation in process positioning and synapse formation.
The equivalent comparison between the two difference animals, however, revealed that the two sides of each animal were more similar than the same sides of different animals, suggesting possible real differences between the two animals. The U series is from an older animal but again, except for the introduction of the major egg-laying motor neurons (HSN's) and a generally raised number of connections from the labial receptors (IL1, IL2 classe), the differences appear to be scattered randomly throughout the circuitry, and to consist mostly of only one or two synapses for any particular pair of cells. Since the animals are isogenic, the systematic differences must be either age related, or a consequence of environmental differences during development. Laboratory specimens of C. elegans are cultured on bacterial lawns grown on agar plates; their environment varies only in the level of food supply and the degree of dessication! There have been no studies to determine whether any of the C. elegans neural circuitry shows variation under different conditions. A possible approach would be to compare the ventral nerve cord circuitry of animals that have been raised swimming freely in liquid culture with the standard nerve cord of animals raised on agar plates, which has been reconstructed many times.
7.10 Connection formation and adjacency
A simple model for formation of synapses between two neurons would be that there is a cell-cell recognition event where the cells contact, and that synapse formation is a local event, so that the probability of forming a synapse, and the number formed, would increase with increasing length of mutual contact. However there is clear evidence from the variation in adjacency and synapse formation in equivalent pairs of cells in the database that this is not the case. Both the probability of forming a synapse, and the number of synapses formed, are essentially independent of the degree of adjacency, providing that some contact is made. This implies that there is internal regulation of synapse formation at a cell-wide level. Such regulation is biologically reasonable, because it would be asking a lot of a process placement mechanism to finely control the exact amount of contact between different neurons, and the circuitry is reasonably fixed. Indeed the adjacency of a particular pair of neurons is much more variable than their connectivity. The next chapter pursues further the question of process placement in the nerve ring.
Although there is no apparent link at the level of individual process pairs, there is a strong general correlation between synapse formation and adjacency. Neuron pairs that are synaptically connected tend to have high adjacencies, and the more synapses they form the higher the adjacency tends to be. The amount of contact is in general much larger than that needed to make the synapses in. In a sense adjacency seems to depend on the likelihood of forming synapses, rather than synapse formation on adjacency. This also makes biological sense, since the goal of positioning nerve processes is to place in contact with each other those neurons that will form connections. However the same correlation is not seen for gap junctions, for which this post hoc biological rationale is just as relevant. This seems to suggest an effect on neuronal placement, and thus possibly process guidance, of either chemical synapses or gap junctions (or something involved in forming them). One might postulate either process attraction linked with synapse formation, or a repulsion, or stopping of growth, associated with gap junctions. When considering connections within the same class it was observed that bilaterally symmetric processes that gap junction with each other often terminate when they meet at the midline, while those few classes that form intraclass synapses all substantially overlap. Elsewhere in C. elegans the muscle arms in the body are clearly attracted to the presynaptic processes, since when motor neuron axons are displaced the muscle arms still go to them and receive neuromuscular input (Chapter 4, and J White, S Brenner, unpublished observations). However, although muscle arms resemble postsynaptic processes, they are phylogenetically anomalous and possibly a special example.
7.11 An underlying pattern of connectivity with additions?
The average number of chemical synapses between a pair of synaptically connected neurons 4.2, and there are many cases with more than 10 synapses, whereas there are rarely more than one or two gap junctions between a pair of neurons. We have seen that in individual cases the level of adjacency between two processes does not appear to be important to synaptic reproducibility. Instead the most significant general factor as an indicator of reproducibility is the number of synapses made. Connections with only one or two synapses are unreliable, while those normally containing many synapses are nearly all present in all cases. This result is statistical; there may be individual pairs of neurons that always connect but only form one synapse (e.g. OLQV and RIC only contact briefly but in each case seen make a single very large synapse full of vesicles). However overall there is evidence that the probability of forming a connection and the number of synapses are linked.
If we consider mismatches in which a connection is present on one side but not the other, there are four times as many cases where the connection is seen on neither side of the other animal as ones in which it is seen on both sides. An explanation of this result would be provided by the hypothesis that there is an underlying pattern of circuitry that is consistently present, but there are also always a number of additional synapses that are selected from a wide range of possibilities, and which therefore do not generate reproducible connections. The distribution of this set of additional synapses was estimated by subtracting away consistently seen synapses. Since this operation was performed with synapses rather than connections it leaves some additional synapses between processes which have a consistent connection, for example where in one of the four cases 10 synapses were made, and in others only 6. However the majority of additional synapses are between processes that are not reproducibly connected, which implies that the variation observed in the circuitry is not simply due to modulation in level of a small restricted set of possible connections. The new connections normally contain only one or two synapses. This would provide an explanation for the low reproducibility of synaptic connections containing only one or two synapses. Both the adjacency distribution of the additional synapses, and a direct count of the proportion of mismatches for which the unconnected pair of neurons are not adjacent, indicate that most of the additional connections are between pairs of neurons that normally have a reasonable adjacency, rather than being due to a process wandering away from its normal circle of connections.
One possible alternative explanation for the extra "random" connections is that they are due to errors in scoring synapses during the reconstructions. It is sometimes hard to unambiguously identify whether or not a process is postsynaptic to a particular synapse. However the fact that the comparison between the U and H series contains many differences with similar characteristics to those described above, but many of which are reproducible from side to side of each animal, suggests that they are real.
7.12 Localisation of synaptic specificity within neurons
There are a significant number of cases where synapses or gap junctions are formed between members of two classes of neurons when they make contact in one place on their processes, but not when equivalent cells touch in other places. It seems more likely that this is due to regional localistion of the potential to form the relevant type of synapse in the same way for all neurons in a class, than to all the different members of each class having different recognition properties. A more direct example of clear localisation is seen in the adult ventral cord, where the VA and VB motor neurons are bipolar, sending out processes in one direction that only receive input, and only have neuromuscular output from their other process, a classical axon/dendrite morphology. The interneurons are closely available to both processes. However many of the ring neurons are not bipolar, and it would appear that many of the specialisations, presumably involving differential localisation of surface components, would have to be between distal and proximal regions of the same nerve process, as in figure 1. The following neuronal classes can be tentatively implicated as candidates for regional specialisation on the grounds that they are involved in more than one mismatch and have a suggestive axonal structure: RMD, SMD, SAA, SIB, SMB, RIC. There are many others with apparently discontinuous axonal structure (White et al., 1986). An example of a different type of change between proximal and distal regions of the same nerve process is given by the single neurite of the major interneuron AIB, which changes relative position in the neuropil, running for the first half of its length with chemical receptor axons, and the distal half with motor neurons and motor circuitry interneurons (White et al., 1983).
7.13 Conclusion
Two types of information can be inferred from the foregoing analysis. First a picture can be drawn of the degree of overall synaptic rigidity in the C. elegans nerve ring, and how the connectivity might vary or be modified. Second there are a number of observations suggesting factors that might be important for the formation of synapses between individual pairs of neurons.
It is apparent that synaptic circuitry in C. elegans is not so rigidly reproducible as the positioning and lineal origin of cells, which are practically identical from animal to animal. However the data support the suggestion that there is a broad core of connections that are constant, including most of the strong synaptic connections containing many synapses. This core is subject to a reasonably low level of variation itself (at the level of one or two synapses per connection), but there are also a number of additional chemical synapses (about 10% of the number in the core pattern) connecting other pairs of processes, which are not reproducible. Gap junctions show less variation, and no indication of a strong additional component.
There is some evidence that the changes and additions might not be random, since there are many consistent ones, each small in itself, between the H series animal and the U series animal. Since these two animals are isogenic they must be due to either environmental or age-related differences. If the additions are functional then there are two possible ways in which they could be used. The first is to "tinker" with a standard pattern, slightly altering the influence of various parts of the nervous system on each other but not changing the functional roles of cells. The second is to introduce a new behaviour, or to flexibly wire a particular task so that it is performed in a different way in different animals. This is different from the question of functional flexibility in a single neuron taking part in more than one task, for which there is plenty of evidence: the IL1 and URA classes are for instance both sensory and motor neurons. Although no data are available on the variability of function of nerve ring neurons in different animals, I believe that two observations point towards the tinkering rather than the respecification theory. First, in no case is a systematic pattern of connectivity change discernible (other than the introduction of the egg-laying circuitry in the sexually mature U series animal). Second, the great majority of changes consist of only one or two synapses per connection.
There are several observations concerning the formation of connections between pairs of neurons. It seems likely that the potential to form synapses and gap junctions may be localisable to particular parts of a single process. The probability of a chemical synaptic connection being formed, which may depend on environmental as well as genetic factors, and the number of synapses formed, appear to be regulated so as not to depend on the amount of contact between a pair of cells. However the factors involved in synapse formation may influence adjacency, because synapse formation, but not gap junction formation, is correlated with adjacency, suggesting that one or the other of the two processes may have an effect on nerve process placement. The evidence for these properties generated by this study is statistical and indirect, and therefore inappropriate as a basis for a series of direct intrusive testing experiments. However it is not susceptible to the bias that might be generated by studying intensively a single connection. Also, since a very large number of cell pairs were considered, it is statistically significant; the conclusions do almost certainly reflect pervasive properties of one simple nervous system, and they may also be relevant to other organisms.
Chapter 8: The Logical Organisation of the Circuitry
8.1 Directionality
8.2 The organisation of the feedback
8.3 The processing depth
8.4 Discussion
As well as looking at typical local interactions between neurons in the nerve ring the completeness of the information in the database allows us to investigate the large scale structure of the neural circuitry. We can ask such questions as: what is the processing depth from sensory input to motor output, i.e. how many intermediary neurons are there?, and to what extent is the circuitry unidirectional, progressing linearly from input to output? It is unlikely to be completely directional; one expects to find a certain amount of feedback, both in control-type circuits, in analogy to electrical engineering, where feedback can be used to adjust gain and bias to optimise the response to stimuli, and in rhythmic pattern generators if they exist. In fact the questions of processing depth and directionality are related, since it is necessary to have ordered the circuit diagram before being able to count the number of intermediary neurons between sensory input at the top and motor output at the bottom. I shall therefore consider first the extent to which the circuit diagram can be directionally ordered.
8.1 Directionality
Let us consider the network of chemical synapses and ignore gap junctions for the time being since, although they can be rectifying and directional, one can not detect any directionality from electron micrographs. The aim is to vertically order the neurons so that as many as possible of the synapses point downwards, with their presynaptic neuron above the postsynatic neuron in the ordering. This was done with a sorting algorithm that is described in the appendix.
In fact the operation was carried out with combined data for neuronal classes, rather than with the individual cells, since all the members of the same class should occupy the same functional position in the circuitry. Since the earlier analysis suggested that there was a core set of connections that were almost always present, to which were added a number of sporadic connections consisting of only one or two synapses, orderings were obtained for two sets of data, one made by adding all the synapses that were seen in at least three out of the four possible places (left and right sides in both H and U series). In the latter case the few synapses between two unpaired cells were only counted if they appeared in both the H and U series. This more stringent synapse set is the same as the set of consistent synapses discussed in Chapter 7. For ease of comparison the summed data were divided by two and the stringent data multiplied by two so that both sets gave numbers in terms of synapses per animal.
The results suggest that on a large scale the circuitry is very directional, and that almost all the chemical synaptic feedback that does take place is in the form of reciprocal synapses. The more stringent set of data could be arranged so that more than 95% of the connections pointed downward, leaving only 140 out of 2890 (4.8%) pointing upward (figure 8.1). Of these, 116 were involved in reciprocal connections, which have to contribute upward synapses because they have synapses in both directions. This leaves only 24 persistently seen synapses that are involved in upward connections, 12 per side. These 12 synapses are distributed over 11 connections, so there is no case in the whole nerve ring of strong, consistently seen, indirect synaptic feedback. However it appears that direct feedback using reciprocal connections is an important feature of the circuitry, since reciprocal connections contained 378 downward synapses as well as the 132 reverse synapses already mentioned, therefore accounting for 20% (494/2890) of the persistently observed synapses.
It was not possible to order the averaged data so clearly. In that case there were 3898 synapses per animal, of which 386 (9.9%) pointed upwards in the arrangement that had been found to be best for the stringent data. When the ordering was specifically optimised for the averaged data the number of upward synapses was only reduced to 328 (8.4%), nearly twice the percentage that was seen with the stringent data. These observations support the suggestion made in Chapter 7 that at least a proportion of the additional synapses are different in nature from the consistently observed synapses, having perhaps a more random distribution.
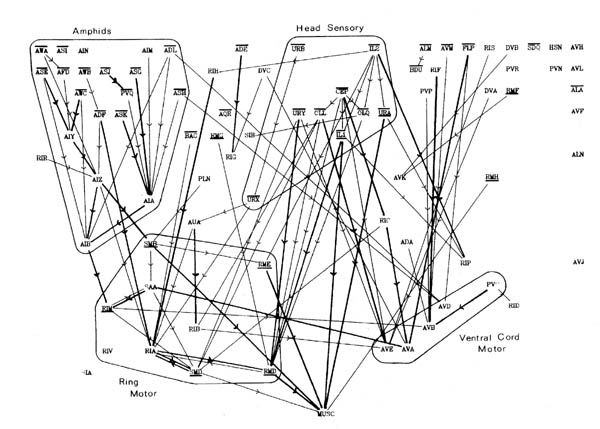
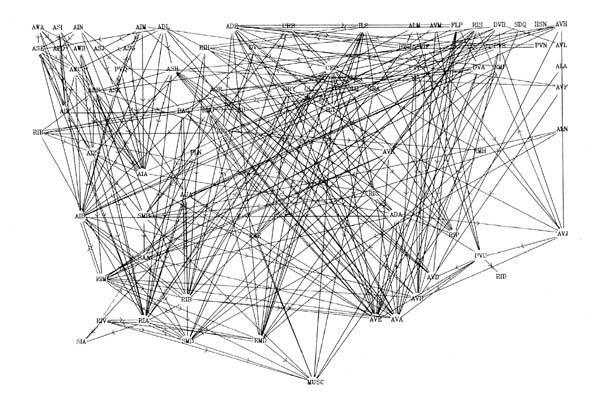
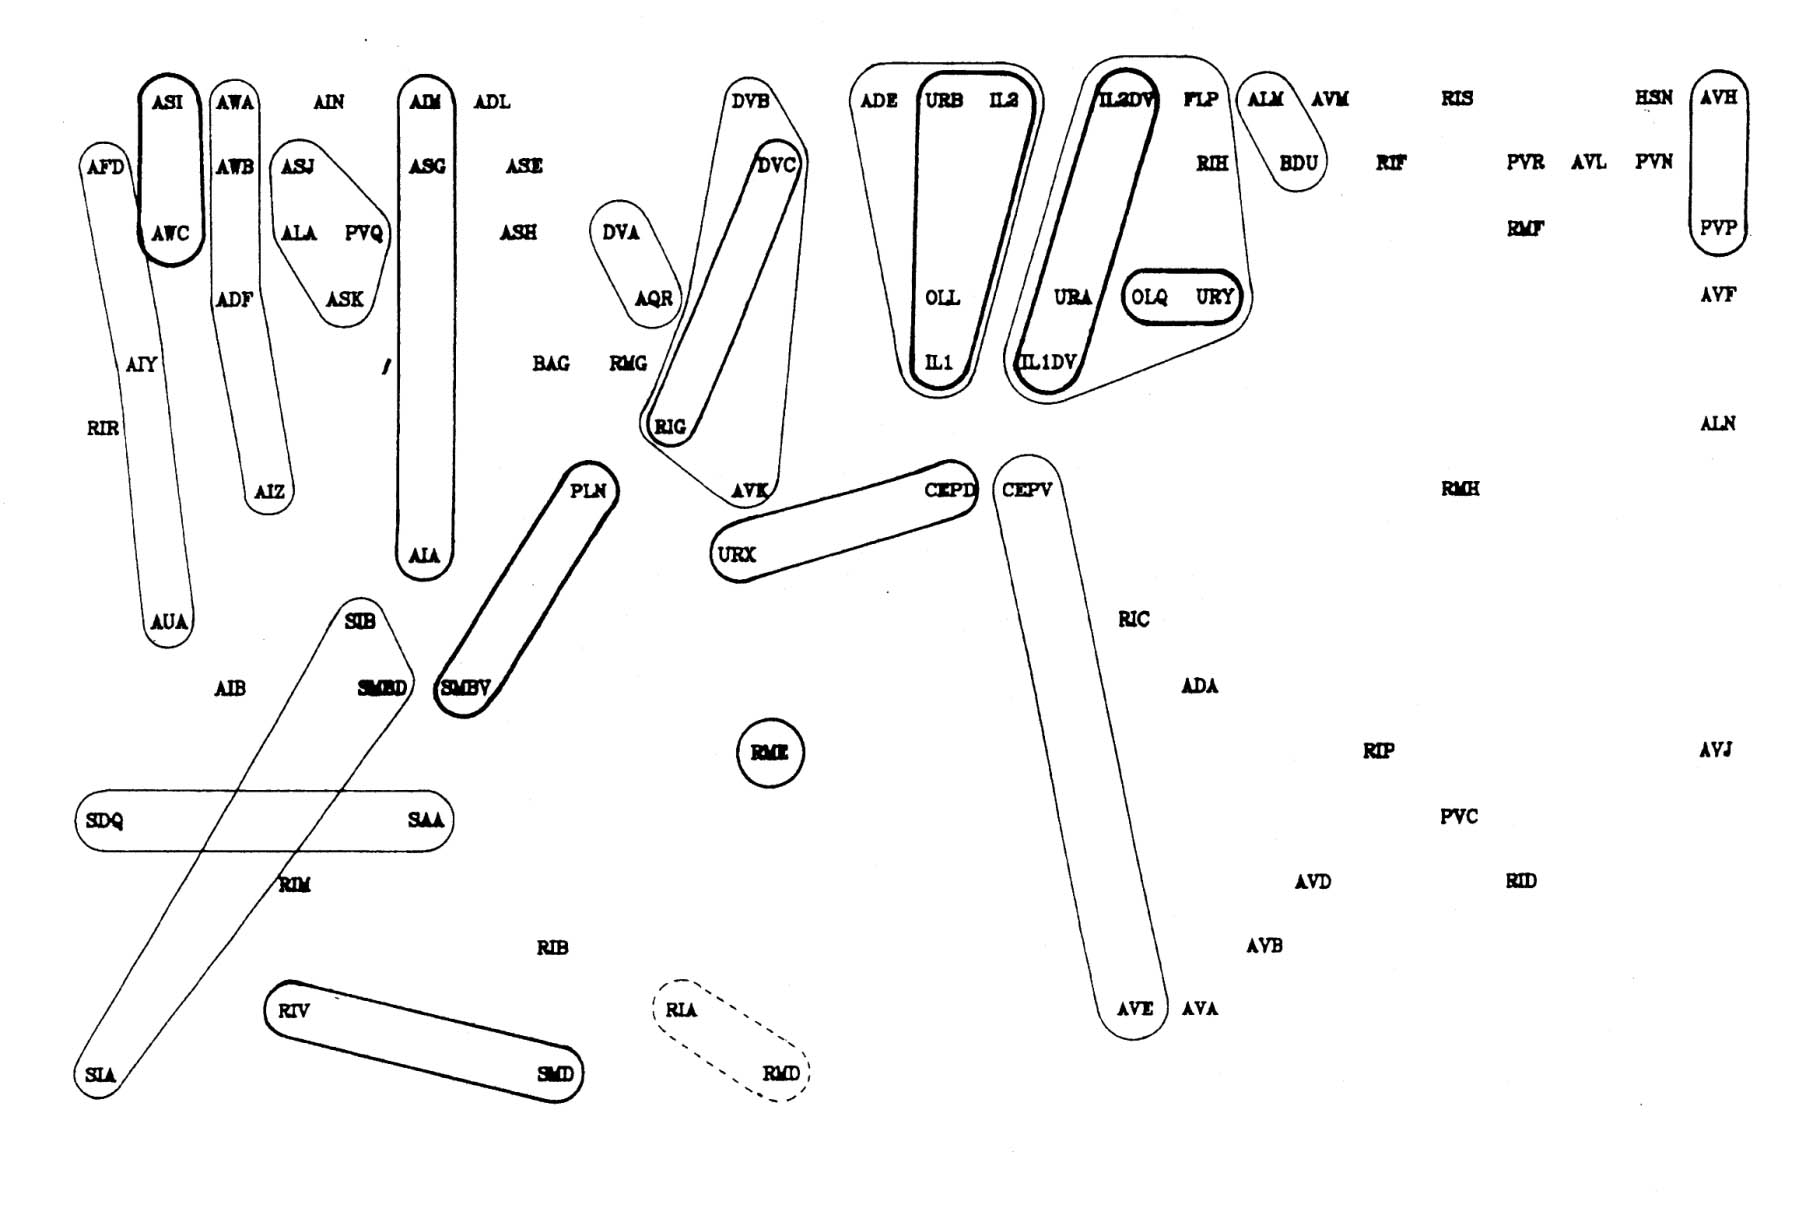
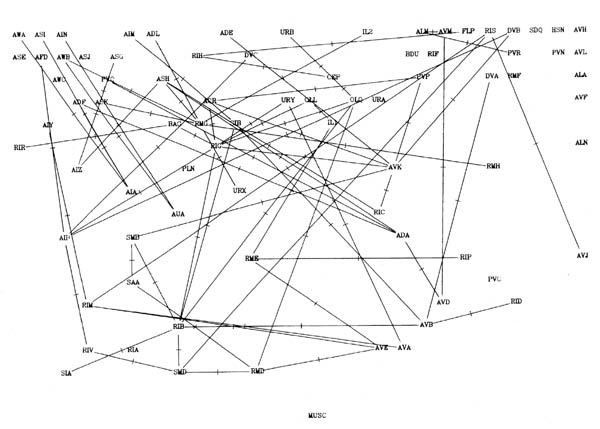 FIGURE 8.1. All the neuronal classes in the nerve ring arranged in the optimal vertical ordering to minimise the number of upward chemical synapses. The next three pages contain 8.1 (a), (b) and (c). Each has the classes arranged in the same positions, but shows different sets of connections.
(a) shows all the chemical synaptic connections in the stringent set with 5 or more synapses with fine lines, and those with 10 or more synapses with heavy lines. Sensory neurons are indicated by a bar above the cell name, and motor neurons by a bar underneath the class name. Four subjective groupings of related neurons are encircled. These are discussed further in the text.
(b) shows all the chemical synaptic connections in the stringent set.
(c) shows all the gap junctional connections in the stringent set.
It was not possible to order the averaged data so clearly. In that case there were 3898 synapses per animal, of which 386 (9.9%) pointed upwards in the arrangement that had been found to be best for the stringent data. When the ordering was specifically optimised for the averaged data the number of upward synapses was only reduced to 328 (8.4%), nearly twice the percentage that was seen with the stringent data. These observations support the suggestion made in Chapter 7 that at least a proportion of the additional synapses are different in nature from the consistently observed synapses, having perhaps a more random distribution.
8.2 The organisation of the feedback
Several groups of neurons have been indicated in figure 8.1 on subjective grounds because they seem to be involved in a particular part of the circuitry. Two sensory and two motor groupings have been defined. One contains neurons associated with the amphid sensilla, which are multiply innervated sensilla on either side at the front of the head, probably concerned mainly with chemo- and osmo-detection (Ward et al., 1975). As well as sensory receptor neurons there are a number of interneuron classes that appear to be predominantly concerned with processing information from these receptors. The other sensory grouping contains a second set of neurons with sensory receptors at the front of the head, distinct from the amphids. These all have their cell bodies in front of the nerve ring, and tend to form direct connections to motor circuitry (or directly to muscle in the cases of URA). There are additional sensory neurons, such as the touch neurons (ALM, AVM, Chalfie et al., 1985) that are not assigned to either of these classes. The two motor circuitry groupings contain the interneurons that innervate ventral cord motor neurons on the one hand, and some of the circuitry that controls neuromuscular activity onto head muscles from the nerve ring on the other hand.
Figure 8.2 shows the amphid circuitry and part of the ring motor circuitry in greater detail, including all the synaptic connections. Although there are several examples of reciprocal feedback they do not interlink the whole circuitry. The groups of neuronal classes that are connected so that each neuron could potentially influence all the others in group are outlined in figure 8.2 (the connection between RIV and SAA breaks this rule, but only contains one consistent synapse). Let us call such groups "modules". Neurons higher in the directional ordering are isolated from modules that lie below them. Thus all the amphid circuitry apart from AIB is isolated from motor activity. In this sense even the reciprocal feedback that is seen only has a limited effect on the overall directionality of the circuitry.
One important consideration that might invalidate the suggestion of a highly directed flow is that we have ignored gap junctions. Figure 8.1c shows the distribution of all the gap junctional connections in the nervous system. Some of these are within groupings identified previously. There are also some classes that make a lot of gap junctions, but very few chemical synapses (e.g. RIG, RMG, AVK). It is of course not known whether or not any of these gap junctions are rectifying and thus possibly directional themselves. However in at least one case a gap junctional connection has been shown to be functionally important in one direction, by removing the cell involved with a focussed laser beam (Chalfie et al., 1985).
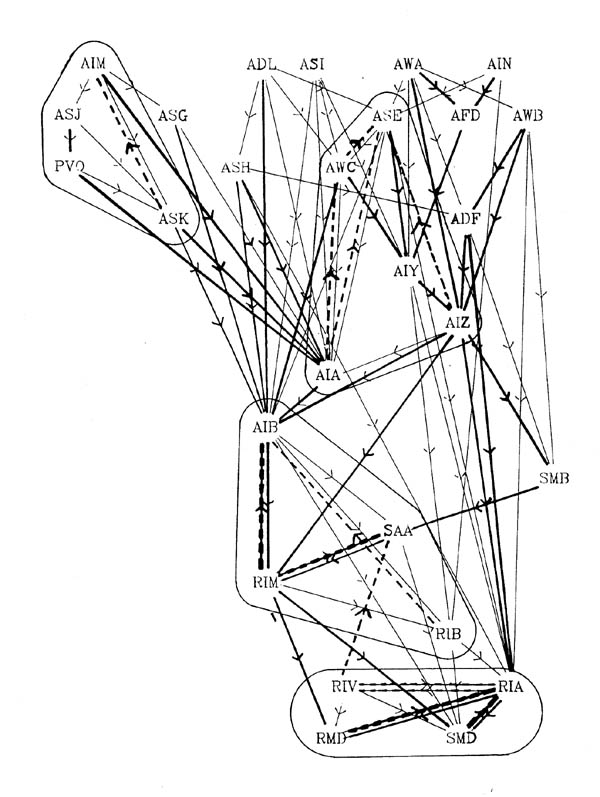 FIGURE 8.2. A more detailed view of a particular part of the synaptic circuitry. This shows the amphid neurons and their main paths of connectivity to the ring motor circuitry. All connections present in the stringent data set are shown; connections with 5 or more synapses have heavier lines. All upward synaptic connections are dashed, again with the dashes being heavier if there are 5 or more upward synapses to the connection. Groups of classes that are potentially connected by feedback are encircled. The only exception is that the upward connection between RIV and SAA was not used to link the AIB, SAA, RIM, RIB module to the RIV, RIA, RMD, SMD module, since it only contains one synapse.
8.3 The processing depth
The ordering of the circuitry allows us to count the number of synapses between sensory input and motor output. The method used calculates a hypothetical flow of information through the synaptic connections down through the nervous system (see Appendix for details). It necessarily treats all the observed synapses as having equal functional effect and so the resulting estimates are probably physiologically very inaccurate. However they provide a reasonable basis for a broad comparison of the flow of information from different sensory modalities.
There are on average 3.5 chemical synapses between sensory neurons and the head muscles, basing the calculation on the more stringent data and the ordering derived for in in section 8.1. As might be expected, there is a lot of variation in the number of intermediary connections. The actual number can vary from a minimum of one in the case of neuromuscular output from the sensory motor neurons IL1 and URA to a maximum of 16 for a particular sequence of synaptic connections starting from the amphid receptor ASI. However this upper band is somewhat misleading; the average distance from muscle of any given neuronal class is never greater than 5.9 synapses (for ASJ). Nevertheless there is clear systematic variation dependent on the type of sensory receptor being considered. Input from the amphid receptors takes the longest time on average to reach muscle (4.4 synapses), reflecting the extra stage of amphid specific interneuron processing shown in figure 8.2. The other head sensory input is rapid, taking only 2.2 synapses on average, and the average value for the remaining sensory neuronal classes is 3.2 synapses.
The same method that calculates depth of processing also generates an estimate of the proportion of sensory influence" that reaches different final types of output (see the appendix for details). There are three major discernible targets for output from the nerve ring: the head musculature via direct neuromuscular synapses, the ventral cord motor circuitry interneurons, and the RIP class of neurons, which provide the sole connection to the pharyngeal nervous system, which is thought to pump constitutively unless repressed by RIP. In general the number of synapses connecting sensory neurons to the ventral cord circuitry or RIP is about one less than the number needed to reach the head musculature, possibly because there is an extra layer of motor pattern generating circuitry (considered further in the discussion). The "fast" head sensory neurons have proportionally more output onto the head muscles, and provide the majority of output onto RIP. It seems reasonable to suggest that they carry out much of the short range sensing involved in moving the head to feed and searching out a path round obstacles for the body to follow when moving. The amphids generate a balanced number of connections to both the head muscles and ventral cord interneurons, and have no link with RIP. The other sensory neurons provide comparatively more input onto the ventral cord interneurons. This is perhaps reasonable because many of their sensory endings are in various other parts of the body, rather than being at the tip of the head.
8.4 Discussion
The strongest general feature of the C. elegans nerve ring circuitry is its extremely high directionality. The neuronal classes can be ordered in such a way that less than 5% of the synapses point backward. This organisation is clearly very different from that of many higher organisms. For example in the mammalian cortex every projection from one area of cortex to another seems to be matched by a reverse projection (van Essen, 1979). However there are also structures that are only a few synapses deep that seem to be fairly directional, such as the vertebrate retina (Sterling, 1983).
Almost all the synapses that do point backward are members of reciprocal connections, which were shown in Chapter 7 to be almost as frequent as would be expected on the basis of the distribution of directed synapses. There are almost no persistently seen synapses involved in indirect feedback. In addition the feedback that is seen appears to be largely restricted to affecting small groups of neuronal classes, or modules. In the case of the circuitry shown in figure 8.2 it is possible to suggest functions for the observed modules in terms of the different stages of processing needed. However in discussing the possible function of elements of the circuitry one should bear in mind that all the data is anatomical; there is no functional or physiological data.
The outputs of the amphid receptors shown in figure 8.2 appear to be processed fairly independently from the rest of the sensory input. Their output is eventually concentrated onto the interneurons AIZ, AIA and AIB. AIZ and AIB synapse onto RIB, RIM and RIA, the major interneurons that appear to be involved in controlling the head musculature. These RIX neurons then synapse onto the RMD and SMD which are two of the main head motor neuron classes, each containing 6 neurons interconnected in a complex fashion (see figure 7.1 for the RMD connections).
Feedback in the AIM, ASJ, PVQ, ASK module could best be used to modulate their own receptor output. The ASE, AWC, AIY, AIZ, AIA group combines the output of a set of, mainly chemosensory, amphid receptors. The AIB, RIB, RIM group receives input from other modalities as well as the processes chemosensory data from the neurons seen in figure 8.2, and has output to both the head and body motor circuitry (RIM is itself a head motor neuron). It may make the basic decision on body movement, which the RIA, RIV module then executes. The feedback in this final motor output module, both between the interneurons RIA and RIV and the motor neurons, and within the motor neuron classes themselves, may be involved in the generation of oscillatory head movements that then propagates backward as waves. In several respects the connections seen here resemble those seen in central pattern generators (oscillation generators) in other invertebrate systems (for several examples see Model neural networks and behaviour, ed Selverston, 1985). In these other systems reciprocal connections between neurons also appear to play an important part, and it is often seen that neurons are multifunctional, for instance with both motor neurons (Miller and Selverston, 1985) or command interneurons (Getting and Dekin, 1985) taking part in the pattern generating circuitry.
One of the proposed modules, the one containing AIB, RIB and RIM, contains a mixture of neurons that subjectively appear to be part of the amphid circuitry (AIB), and the motor control circuitry (RIB and RIM). Much of the amphid receptor circuitry shown at the top of figure 8.2 is concentrated onto AIA and AIB. It appears that one of these two neurons may be involved in feedback within the amphid circuitry, possibly to "tune" its output, while the other is involved in feedback that may determine the relative importance of the amphid output to the movement of the animal. Another suggestion to explain the organisation of AIA and AIB, made initially by J G White, is that they receive joint input and that AIA inhibits AIB, thus causing the combination to act as a differentiating circuit which could be used to detect gradients during side to side head movement.
The principle of a highly directed network containing small processing modules provides for only a very limited use of circuit feedback. This use is to improve the versatility of small scale processing units made out of a very few neurons. One reason that C. elegans does not have longer loop neural feedback may be that, having only a shallow overall processing depth, it uses sensory feedback to perform this role. The advantage of this is that it measures the actual, rather than the intended, outcome of motor activity. Indeed it is thought that proprioceptive feedback may be important in the propagation of locomotory waves down the body. However, even if more complicated nervous systems do have more sophisticated circuit structures, it may still be useful to effectively isolate functional units as much as possible from the internal working of other parts of the nervous system, even if those working are somewhat relevant. If this is done then additional operations can be added easily at any stage without perturbing the rest of the system.
Chapter 9: Process Placement in the Nerve Ring
9.1 Specific persistent contacts
9.2 Identified bundles
9.3 Discussion
In order for nerve cells to make connections with each other they must be in physical contact. Therefore the physical arrangement of the neuropil is an important part of its design. The C. elegans nerve ring is essentially a large parallel bundle of fibres bent around the pharynx. A typical transverse section through the C. elegans nerve ring shows an apparently homogeneous group of process outlines on each side. Bilaterally symmetric processes occupy approximately symmetrical positions within the bundle, but there is local disorder on the scale of a few process diameters so that in general it is impossible to identify processes on the basis of their positions, even over fairly long stretches of reconstruction (although characteristic diagnostic properties of certain neurons do make them identifiable).
It is presumably unnecessary to specify the exact relative positions of all the processes, but important for there to be reasonably tight control over process position because processes do not branch, so the only way to make contact is to lie next to each other in the bundle. How is position controlled? There are essentially two different possible sources of order, either from contact with other processes or from an external source of information, such as a gradient (e.g. Bonhoeffer and Huf, 1982). The most likely form of contact mediated information would be a mutual adhesivity that kept two or more neurons together and therefore simplified the task of specifying their positions. Such selective fasciculation has been proposed as important in laying down other invertebrate nervous systems during development (see chapter 1 for review) and there are indications that it is important in process outgrowth in C. elegans (PVP behaviour, discussed in chapter 5).
9.1 Specific persistent contacts
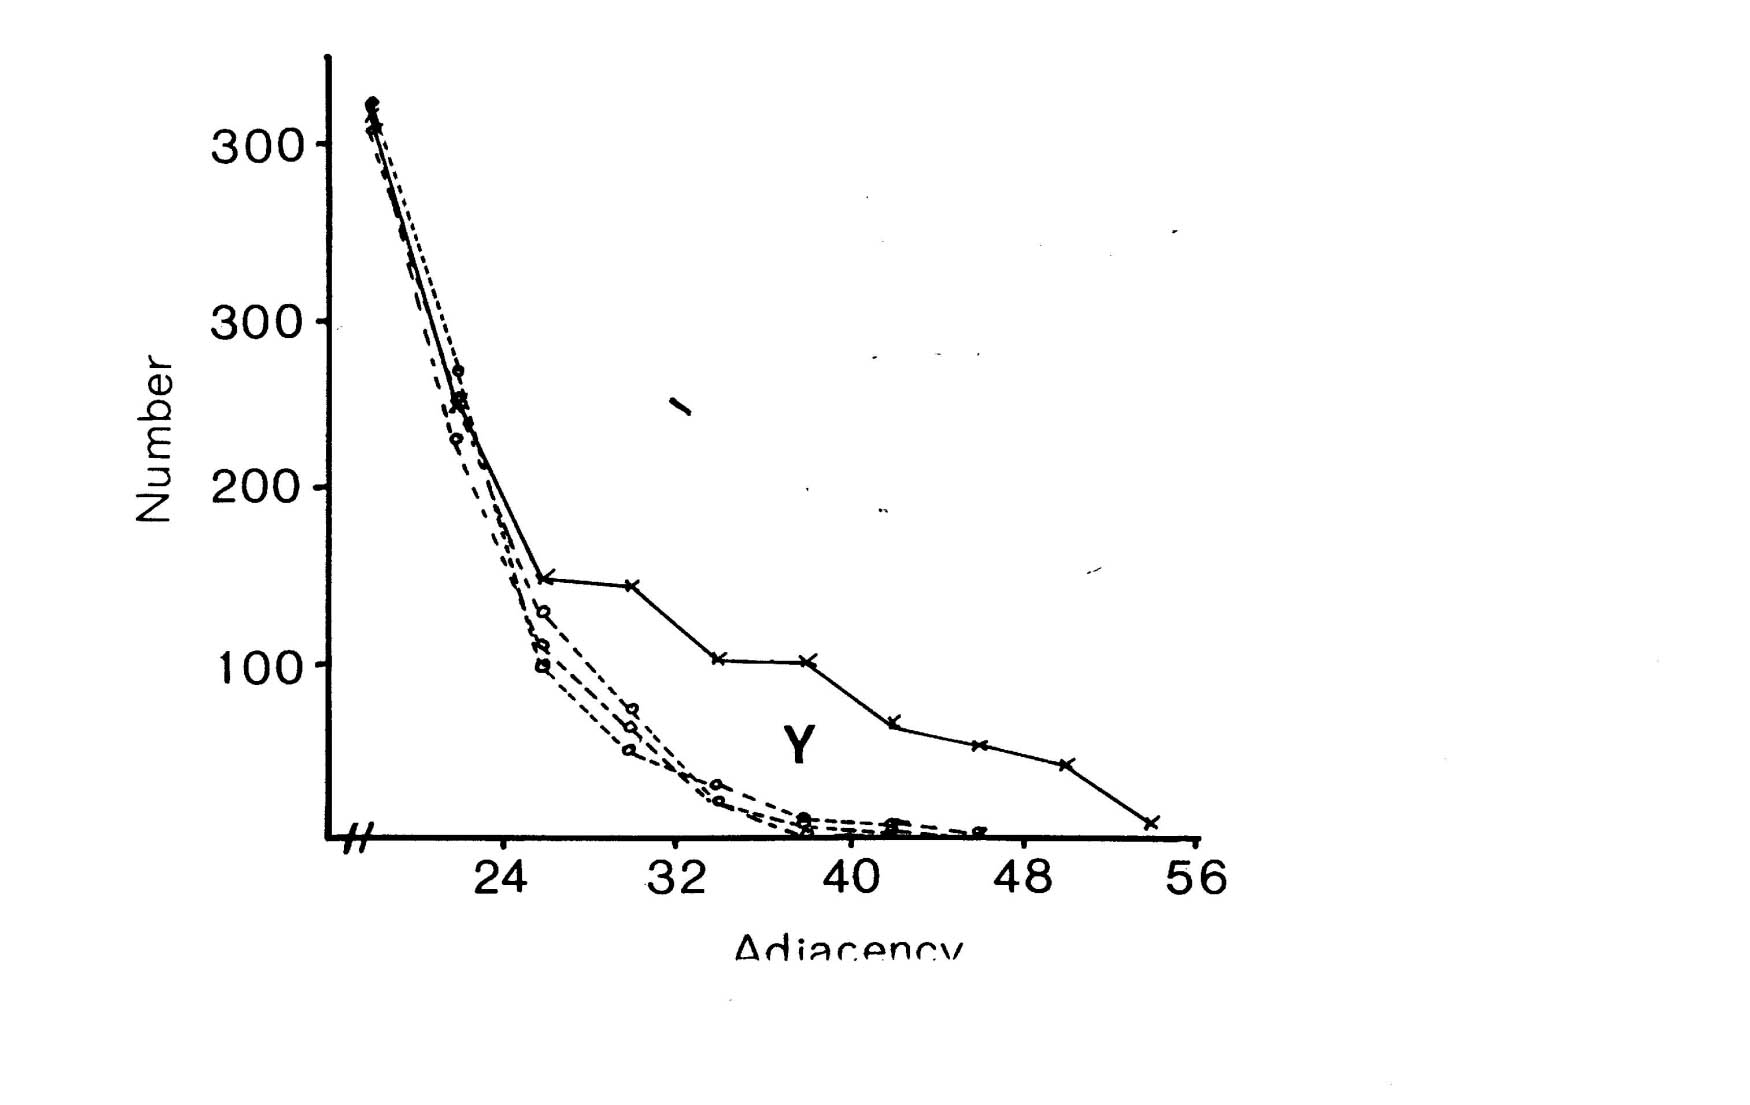
If selective fasciculation were important in organising the nerve ring, and the adhesive forces remained after early development, then one would expect to find pairs of processes with persistent contacts. These should be detectable in the database as pairs of neurons with exceptionally high adjacencies. If one looks at the distribution of all the adjacencies in the database it would be the sum of two components, a random mixing component, and a high adjacency component due to persistent contacts. The distribution of adjacencies is shown in figure 9.1. There is a clear change in slope at the curve at an adjacency of around 30.
In order to assess the significance of this shoulder, and to estimate its size, and hence the average number of persistent contacts made by a neuron, I produced a stochastic model of a collection of randomly mixing parallel fibres. This operates by recording the positions of the fibres in a hexagonal grid representing a slice through the process tract, and then moving to the next slice and allowing neighbouring processes to exchange positions with a certain probability. The adjacency of a pair of fibres is then taken to be the number of slices in which they are neighbours. The total number of slices was taken to be 75 to make the total adjacency (sum of all its adjacencies) of each fibre the same as the average total adjacency for the processes in the database. The second parameter, the probability of a process switching, p, was chosen so as to best match the model's distribution of adjacencies to that of the database. The best fit is given by p = 0.08.
There are two regions of misfit that cannot be eliminated, denoted by X and Y. Region X is due to a very large number of additional contacts of very short duration, which probably arise from processes crossing at an angle in the nerve ring. Such events are known to occur in the nerve ring but are not considered by the computer model. Region Y is the shoulder that includes longer contacts than predicted by the random model. Figure 9.2 shows an expansion of the shoulder region of the database distribution together with data from 3 simulations of the model. The shoulder is clearly significant beyond the variation in the simulations due to randomness in the model. However it is fit quite well by the random model with a low switching probability (p= 0.025, figure 9.1), which is not surprising, because low switching probabilities for a subset of process pairs are an approximation to specific adhesion between the processes, which is the sort of feature that we predicted might give rise to a shoulder beforehand.
It is possible to estimate the number of significantly persistent contacts from the graph in figure 9.2 as about 400, and thus to arrive at a figure of on average 2.3 persistent specific contacts per neuron. This is very crude - there may be many specific contacts of shorter length - but it gives an indication that there may be fascicles or bundles of mutually adhesive processes in the C. elegans nerve ring. However if such bundles are common then they cannot contain very many processes, because the average number for long bundles must be only 3 or 4. A second test suggests the same result. The average number of contacts made by a neuron is 52.1, most of which are short. If we compare the adjacencies of all the contacts with that of the longest contact then we see that on average 12.6 are longer then 25% of the maximum, only 4.8 are longer than 50% of the maximum, but 2.4 are longer than 75% of the maximum. Thus it seems that a very small number of contacts are comparatively consistent.
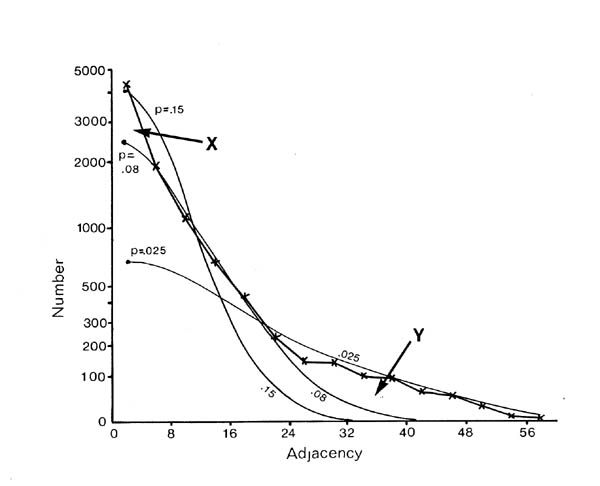 FIGURE 9.1. The distribution of adjacency in the database. The crosses connected by the heavy line indicate the number of cell pairs in the database with a particular adjacency. The fine lines are the corresponding numbers from the outcome of the random mixing stochastic model, using three different values of the parameter, p, and averaged over 10 runs to get smooth results. The best overall fit to the distribution is given by p - 0.08. This leaves two regions of misfit, X and Y, which are discussed in the text. Note that the vertical axis in this graph is nonlinear.
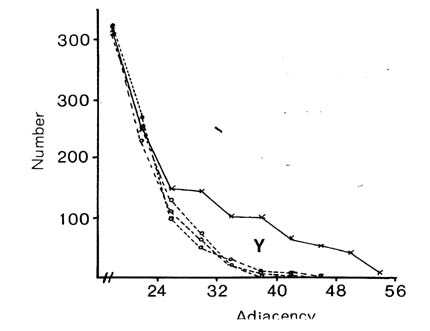 FIGURE 9.2. An expansion of the region Y with three separate simulations of the random mixing model with p = 0.08. The gap between the true data and the model data is clearly significant. Since the vertical scale is linear in this case the area of region Y corresponds to the number of "extra" high adjacency contacts. This predicts around 400 extra persistent contacts, or 2.3 per neuron (178 neurons).
9.2 Identified bundles
It is hard to tell with individual process pairs whether their high adjacency in accidental or not, but if several processes combined in a bundle it should be objectively deducible from the adjacency information in the database. A bundle will consist of a group of processes with the property that all pairs in the group are highly adjacent, but no other process is very adjacent to the group as a whole.
The number of possible groups goes up exponentially with the size of the group, so it is not possible to try every one even with small groups. However there is a branch of multivariate statistics called cluster analysis that is specifically designed to handle this type of problem, and a variant of a standard algorithm from this theory was used to extract clusters of highly mutually adjacent processes that are likely candidates for bundles. The details of this algorithm are given in the appendix, but the final result is a hierarchial set of nested clusters with a measure of the degree of association at each level, which corresponds to an average internal adjacency. Any real clusters, such as the proposed bundles, should stand out as having a high association measure at the level of the group, but not combine well with an external process or group at the next level down. Figure 9.3 shows the bundles detected by the algorithm in the C. elegans database at associations measure cutoffs of 25, 15 and 8. In the case of contralateral homologues, either bundles were seen on both sides, or the same bundle included both homologues.
In order to provide an objective significance criterion for the association measure of a cluster, I used the same algorithm on data from a simulation of the random mixing model described in the last section (with p = 0.08). The maximum association measure obtained was 12.75 and less than 10% of the values were greater than 7.5. Thus according to this criterion all the bundles shown in figure 9.3 at an associational level of 15 are likely to be significant, as are most of those at a level of 8, especially when they occur on both sides of the animal.
Since the clustering method is hierarchial and continues to make larger and larger clusters it does generate further amalgamations of the bundles seen in figure 9.3. Although the association measure for such bundles falls below our significance test level there is evidence that some of them are real, primarily because the same groupings are seen for homologous bundles on the two different sides of the same animal. The fact that they have a low association measure implies that they are not true completely mixing bundles, but they may be either super-bundles - bundles of bundles - or cases where processes are shared by several bundles. The suggestion that particular processes might belong to more than one bundle is taken further in the discussion section.
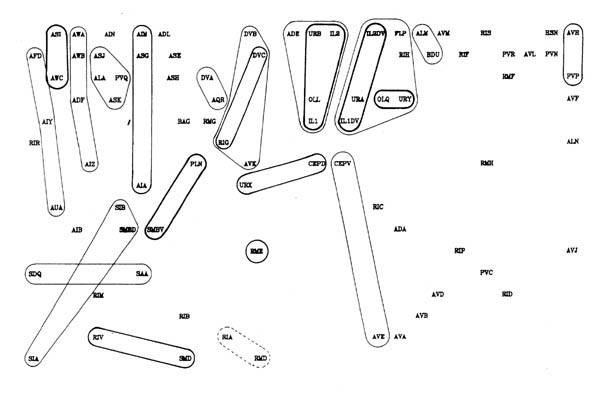 FIGURE 9.3. Clusters of neuronal classes obtained by hierarchical clustering of the adjacency data. There are three thicknesses of line, corresponding to an association measure of 25 or more for the thickest, 15 or more for the intermediate one, and 8 or more for the thinnest one. All these clusters were seen on both sides of the nervous system. In some cases the dorsal and ventral members of the same class ended up reproducibly in different clusters (e.g. CEP, IL1, SMB). The positions of classes were moved as little as possible from those in figure 8.1, in order to show the relationship between possible bundle assignments and circuitry. The RME class is ringed because the four RME neurons form a tight bundle with each other. The RIA and RMD classes are linked in a dashed cluster because there are a number of RIA/RMD pairs that have associations just under 8.
9.3 Discussion
There is some evidence in the database for the presence of reproducible persistent contacts between nerve fibres, both between pairs of neurons and between groups of three or more processes that run together round the ring as sub-bundles within the complete process tract. The largest grouping of neurons which all had fairly high adjacency to each other contained seven cell types (figure 9.3) but most of the likely bundles generated by cluster analysis of the neighbourhood information contained only two or three cell types. The average number of high adjacency contacts per neuron was also small (2.3).
The analysis presented here suffers from its reliance on identifying specific contacts by unusually high adjacencies. It would therefore miss any important short term contacts, and would also be confused by processes that for half their length are in one part of the neuropil, and for the other half in another part. There is a clear example of such behaviour in the case of the interneuron AIB, which runs near AIA in the proximal part of its trajectory, and near RIB in the distal part (White, 1983). This is consistent with AIB's role as the major linking interneuron between the amphid receptor circuitry and the motor control circuitry (figure 8.2). Such switching of bundles could be used by other processes that carry information between sufficiently different groups of processes.
Another example of the possible presence of sub-bundles in the nervous system is provided by the motor neuron processes in the ventral nerve cord. The VA and VB classes of motor neuron are both bipolar, with an axonal process that produces neuromuscular output for part of its length (the other part neither makes nor receives connections) and also receives some input, and a dendritic process that is purely postsynaptic. All the dendrites run together in one place, under the main motor neurons, while all the axons run in a group against the basement membrane. Although these two groups of processes are adjacent they rarely mix. In addition there are a number of places where a motor neuron commissure cuts across the entire nerve cord; when this happened the commissure usually runs between the dendritic and axonal groups, separating one group from the other, but splitting neither (7/13 cases; in 5/13 a VB dendrite is on the wrong side - in only one case is the axonal bundle split). In this case a general adhesion between like processes may be useful in keeping all the dendrites near their source of inervation, and keeping the axons near the basement membrane, where neuromuscular junctions are made.
There is a strong relationship between the proposed groupings of the neurons into bundles and the circuitry. Figure 9.3 has been organised so as to show the extent to which the bundles are formed from neurons that are near in the processing diagram in figure 8.1, which was obtained purely from connectivity data. However it is by no means true that all persistent pairwise contacts are between neurons that are connected, either by chemical synapses, or by gap junctions (e.g. CEP and URX, or the ventral cord motor neuron bundles). In some cases bundles correspond to parts of the processing modules defined previously on the basis of internal feedback, but they also often contain vertical groupings of neuronal classes from the directional ordering, sometimes with elements from two modules, one of which feeds into the other. Such organisation is to be expected if the main criterion for process placement is to maximise the adjacency of synaptic partners, since the main flow of information is down through the network, across the modules.
The observation that there are a small number of persistent contacts suggests that specific fasciculation mechanisms are significant in the C. elegans nerve ring, and appears to rule out the specification of process position by a general mechanism that acts equivalently on all cells. This is perhaps not surprising in an organism with such a small number of cells, almost all of which are distinct, forming different sets of specific connections. The data certainly do not allow the prediction of a set of hierarchical forces that could determine position in the nerve ring. There is also the problem present in all the analysis of the database of trying to investigate the underlying mechanisms involved in building a structure (the nerve ring) by looking at the finished product. However, taken together with the evidence for the role of specific fasciculation in embryonic neural outgrowth presented in the first part of this thesis, there are strong grounds for believing that the organisation of the nerve ring may make use of small specific bundles to correctly position processes so that synaptic connections can be made.
Appendix
A.1 The statistical test for synapse number correlation with adjacency
A.2 The sorting algorithm used to order the neural circuitry
A.3 The method used to determine processing depth
A.4 The clustering algorithm used to detect bundles
A.1 The statistical test for synapse number correlation with adjacency
All pairs of neurons A,B in the H series were considered for which there was a synaptic connection both from A to B and from A’ to B’ (A’,B’ are the contralateral homologues of A,B), but where the adjacency between A and B was different from that between A’ and B’. Let S1 be the number of synapses from A to B, S2 can be the number from A’ to B, a1 be the adjacency of A and B, and a2 be the adjacency of A’ and B’. Since each set of four is only counted once we can assume that a1 > a2. The ai are treated as independent variables (i.e. they do not depend on the si), and the si are treated as the outcomes of randome variables Si, which are possibly dependant on the ai. There are two hypotheses that will be tested: a proportional relationship between Si and ai, and independence. More precisely, the proportional model presumes that synapses are made with a certain probability per unit of length of contact. In this case Si will be Poisson distributed with mean (and variance) proportional to ai. However the constant of proportionality may differ for different sets of A,B,A’,B’. The independent model proposes that the Si have mean S, independent of ai, but again possibly different for different sets of neurons.
The test statistic that was used is the sum over all chosen sets of T = (a1s2 — a2s1).
If Si is proportional to ai, then T should have mean value zero. Its variance can be estimated as the sum of the variances of the contributing terms, which are (a12a2m + a22a1m) where m is the Poisson rate, best estimated by (s1+s2) / (a1+a2). This simplifies to being the sum over all the sets of a1a2(s1+s2).
If Si is independent of ai, then T should have mean M, where M is the sum over all the sets of S.(a1-a2), where S is the mean number of synapses for each set. The best estimator for S is (s1+s2)/2. In order to estimate the variance of the differences from the mean, (M-T), we must propose a variance for Si. (It cannot be estimated because then we would lose all our degrees of freedom). It seems reasonable to assume in this case also that the Si have a Poisson distribution, or in any case that their variance is approximately the same as their mean, S. Then the estimated variance of (M-T) is the sum over all sets of S.(a1+a2)2/2.
To test each hypothesis the difference between T and its expected value under the hypotheses is divided by the standard error (the square root of the estimated variance) to give a normalised error, U. Since we are adding together hundreds of similar terms T should be distributed normally, and so theoretically U has a t-distribution, since we have estimated the variance of T. However, because there are hundreds of degrees of freedom (one for each set), U can be tested as if coming from a standard normal distribution.
In total there were 391 sets. The value of T was 7103. If we assume the proportional hypothesis then the standard error is 1324.3 and U is 5.36 which is very significant. We can therefore reject the proportional model. If we assume the independent model then M is 7655 and the standard error is 1338.0 so U is 0.41, which is not significant. So it is quite possible according to this test that the number of synapses formed is independent of adjacency.
A.2 The sorting algorithm used to order the neural circuitry
The basic method of this algorithm is to start with a random ordered list and repeatedly use a simple rearrangement principle to reduce the overall number of upward synapses. The process stops when this number cannot be improved by a rearrangement of the type under consideration. In general this will not give a true optimum order, because the rearrangement principle is not general enough. However, by repeated application of the algorithm to different starting lists one can get an indication of the distribution of final results. If, as they were in the case under consideration here, the results of these repeated optimisations are very similar, then it is likely that they are near the true minimum. The algorithm was run many times until the lowest value so far had come up repeatedly, at which point it was accepted as the optimum.
The actual rearrangement system chosen in this case is to run through the current list and, for each neuron, determine where in the list it should be placed. If this is different from the current position then it is moved there and the neurons in between are shunted one place back in the list to fill the gap.
A.3 The method used to determine processing depth
This method deals with some notional material (sensory influence) which flows down through the network of connections, moving through a synapse at each time step. Each sensory neuron under consideration is given a unit amount of material at time zero. Then at successive time steps the material is redistributed, all the material in each neuron being divided amongst the neurons that it both synapses to and is above in the ordering. The amount that each postsynaptic cell receives is proportional to the number of synapses made. If there are no postsynaptic partners then the material is lost. Clearly material can reunite that has come via different routes but using the same number of synapses from sensory neurons. The requirement that only downward synapses are permitted prevents problems with cycling.
This method makes the assumptions that the influence of a connection is proportional to the number of synapses it contains, and that influence is neither lost nor amplified, merely passing through neurons and being redistributed at each time step. Both these assumptions are neurobiologically unrealistic, but they are probably the best that can be done with the information available. By keeping track of the distribution of material at each time step one can build up a picture of the distribution of time steps required for influence to reach a specific neuron (muscle can be treated as the final postsynaptic neuron), and also of the proportion of influence from the chosen set of sensory neurons that passes through any particular interneuron, or for instance that reaches head muscle as opposed to body muscle.
A.4 The clustering algorithm used to detect bundles
This is a hierarchical clustering algorithm (see e.g. Seber, 1984). The principle is to identify the two items that are most likely to belong to the same group and to link them together. Then a new distance, or, in our case, adjacency, is defined between this pair and each of the remaining items. One then returns to the first step and looks for the most adjacent pair in the reduced set of items, which will include a combined pseudo-item. This process of joining the two closest items continues recursively until only one item is left. At each stage a measure of the association of the two items joined together is given by their adjacency, which in general is a combined adjacency.
Different versions of this process vary in the way that the combined adjacency of the merged item to the remaining items is determined. I used a variant of the group average method (Seber, 1984) that was tailored to this particular problem. I kept data on the circumferential zones of the nerve ring in which each process ran (e.g. lower left). This was necessary because it is only possible for two processes to be adjacent to the extent that they run in the same zone. The adjacency between two groups is then defined as the ratio of the total adjacency between their constituent processes to the summed circumferential zone length that they have in common. By keeping the total constituent adjacencies and the summed zonal lengths at each stage these "zonal ratios" can be easily combined when two items are merged. I also prevented the fusion of groups with comparatively small overlaps, because the data for such cases would be correspondingly noisy and if they were to belong to a genuine bundle there would have to be an overlapping intermediate fibre in any case. This zonal ratio system does, however, permit bundles that are longer than some, or even all, of the constituent processes, and this is an important feature of it.
Conclusion
The results of the various observations and experiments described in this dissertation have been discussed already in their own sections. Therefore instead of rehashing the same arguments I propose here to consider these results in the light of previous experience with using C. elegans as a model developmental animal, and to speculate in which type of direction future work, particularly on the genetics of neural specification, might take us.
The studies described in both parts of this dissertation have relied on the fact that the C. elegans nervous system is both extremely simple and highly reproducible, so that information can be gained from a comparatively small amount of data. However there is also a possible penalty to be paid in studying an organism with a very small number of cells, all of which are reproducible from individual to individual. These properties potentially permit structures to be put together piecemeal by some form of internal program specific to each part, rather than by general mechanisms.
The initial reason for attempting a computer database analysis of the synapse and connectivity data was to attempt to find internal logical patterns in the connectivity data which might allow rules to be proposed for specifying which cells connected to which, for instance by placing the neurons in possibly overlapping "super-classes" that might have common recognition properties, so that if two cells were in compatible classes and also in contact then they would form a connection. There are examples of pairs or groups of cells that are in different places and make mostly different connections, but which make similar connections to cells that they both contact, and which share other properties in common (White et al., 1983). However an overall search for such grouping reveals nothing that is statistically significant. One possible problem that may be important is that regional specialisation of neurons, as discussed in Chapter 7, would create complications in any search for classes of neurons with equivalent synaptic potential. This does not mean that label receptor matching systems for determining synaptic connectivity do not exist, but merely that there are too few cells and there is too much variation to deduce them from the final connectivity data.
A similar observation was made when the complete cell lineage was determined, which is more reproducible than the nervous system. Although there are a few suggestive repeated motifs, the overall arrangement of which precursors produce which cells is essentially haphazard and mosaic, correlating as much with position as with pattern in the lineage (Sulston, 1983). This could be taken to indicate that external interactions with extracellular environment were important in determining cell fate, but ablation experiments largely revealed no effect on adjacent cells (Sulston and White, 1980, Sulston et al., 1983). Overall this suggests intrinsic programming, but it has an advantage for the study of intercellular determination, which is that those instances where specific cell interaction is important, of which there are a number of clear examples (Sulston and White, 1980), may be comparatively isolated. A number of the cell lineage mutants that have been obtained affect situations where induction or regulation takes place (Sternberg and Horvitz, 1984), and these may provide an excellent tool to study specific determinitive cell interactions during development in vivo. One particular gene of this type has recently been cloned and sequenced, and its protein sequence has homology to a family of extracellular proteins including growth factors and their receptors (Greenwald, 1985). Indeed there is an argument that clean developmental switch genes, which cause the change of cell fate from one type to another, will often be associated with inductive or regulative situations: a defect in a single component of an extracellular signalling pathway, such as the signal or the receptor, would cause an effective loss of signal, while internal choice determination may be a complex activity requiring many components simultaneously at each stage, and with no clear default behaviour. Having obtained one of the components for an interactive mechanism via a mutant, one then has a genetic handle on the subsequent parts of the mechanism.
The relative positioning of neuronal processes is much more complex than that of most other types of cells, and it must be expected that a large amount of intracellular interaction is required for process positioning and synapse formation. However much of this may be non-specific. As with the lineage ablation studies, the ablation experiments described in Chapter 4 in general had remarkably little effect on other cells. The DD3/DD5, DVC and PVPL removal experiments showed no immediate effect on guidance of other neurons at all. As discussed in Chapter 5 there are already mutants affecting process guidance in various ways. There are also mutants known that affect synaptic connectivity in the ventral and dorsal nerve cords in a way that can be interpreted as switching the specificity of certain cells from one type to another (J. White, L. Nawrocki, personal communication). It is possible that some of these mutants may also affect comparatively isolated determinative intercellular interactions, which may provide models for similar interactions in more complex animals. Even if not they may still reveal interesting mechanisms involved in specific guidance and synaptic connectivity. However, by itself, genetics can be problematical because it may be hard to determine what one is studying. It is ultimately in combining genetics with the detailed and specific anatomical observations and experiments that are possible in such a simple organism that I believe C. elegans has most to offer development neuroscience. If I were to continue working with C. elegans I would investigate the early anatomical development of some of the guidance mutants and follow up the molecular and genetic opportunities they generate.
References
Albertson, D.G. and Thomson, J.N. (1976) The pharynx of Caenorhabditis elegans, Phil. Trans. Roy. Soc. London Ser. B, 275, 299-325.
Baron-van Evercooren, A., Kleinman, H.K., Ohno, S., Marangos, P., Schwartz, J.P. and Dubois-Dalcq, M.E. (1982) Nerve growth factor, laminin and fibronectin promote nerve growth in human fetal sensory ganglion cultures, J. Neurosci. Res., 8 179-195.
Bastiani, M.J. and Goodman, C.S. (1983) Neuronal growth cones: specific interactions mediated by filopodial insertion and induction of coated vesicles, Proc. Nat. Acad. Sci. USA, 81, 1849-1853.
Bastiani, M.J. and Goodman, C.S. (1986) Guidance of neuronal growth cones in the grasshopper embryo. III. Recognition of specific glial pathways, J. Neurosci., 6, 3542-3531.
Bastiani, M.J., du Lac, S. and Goodman, C.S. (1986) Guidance of neuronal growth cones in the grasshopper embryo. I. Recognition of a specific axonal pathway by the pCC neuron, J. Neurosci., 6, 3518-3531.
Bate, C.M. (1976a) Pioneer neurons in an insect embryo, Nature, 260, 54-56.
Bate, C.M. and Grunewald, E.B. (1981) Embryogenisis of an insect nervous system II: A second class of neuron precursor cells and the origin of the intersegmental connectives, J. Embryol. Exp. Morphol., 61, 317-330.
Bentley, D. and Keshishian, D (1982) Pathfinding by peripheral pioneer neurons in grasshoppers, Science, 223, 493-495.
Blair, S.S. and Palka, J. (1985) Axon Guidance in the wing of Drosphila, Trends Neurosci., 8, 284-288.
Bonhoeffer, F. and Huf, J. (1982) In vitro experiments on axon guidance demonstrating an anterior-posterior gradient on the tectum, EMBO J., 1, 427-431.
Dowling, J.E. and Boycott, B.B. (1966) Organization of the primate retina: Electron microscopy, Proc. Roy. Soc. London Ser. B, 166, 80-111.
Bray, D. (1979) Mechanical tension produced by nerve cells in tissue culture, J. Cell Sci., 37, 391-410.
Bray, D. and Chapman, K. (1985) Analysis of microspike movements on the neuronal growth cone, J. Neurosci., 5, 3204-3213.
Bray, D., Wood, P. and Bunge, R.P. (1980) Selective fasciculation of nerve fibres in culture, Exp. Cell. Res., 130, 241-250.
Brenner, S. (1974) The genetics of Caenorhabditis elegans, Genetics, 77, 71-94.
Caudy, M. and Bentley, D. (1987) Pioneer growth cone behaviour of a differentiating limb segment boundary in the grasshopper embryo, Dev. Biol., 119, 454-465.
Caviness, V.S. and Rakic, P. (1978) Mechanisms of cortical development: a view of mutations in mice, Ann. Rev. Neurosci., 1, 297-326.
Chalfie, M. (1984) Neuronal development in Caenorhabditis elegans, Trends Neurosci., 7, 197-202.
Chalfie, M. and Sulston, J.E. (1983) Developmental genetics of the mechanosensory neurons of Caenorhabditis elegans, Dev.e Biol., 82, 358-370.
Chalfie, M., Thomson, J.N. and Sulston, J.E. (1983) Induction of neural branching in Caenorhabditis elegans, Science 221, 61-63.
Chalfie, M., Sulston, J.E., White, J.G., Southage, E., Thomson, J.N. and Brenner S. (1985) The neural circuit for touch sensitivity in Caenorhabditis elegans, J. Neurosci., 5, 956-964.
Chitwood, B.G. and Chitwood, M.B. (1974) Introduction to Nematology, Univ. Park Press, Baltimore.
Constantine-Paton, M. and Capranica, R.R. (1976) Axonal guidance of developing optic nerves in the frog 1. Anatomy of the projection from transplanted eye primordia, J. Comp. Neurol., 170, 17-22.
De Cino, P. (1981) Transmitter release properties along a regenerating nerve process, J. Neurosci, 1, 308-317.
Doe, C.Q. and Gooman, C.S. (1985) Early events in insect neurogenisis II. The role of cell interactions and cell lineage in the determination of neural precursor cells, Dev. Biol., 111, 206-219.
Doe, C.Q., Bastiani, M.J. and Goodman, C.S. (1986) Guidance of neuronal growth cones in the grasshopper embryo IV Temporal delay experiments, J. Neurosci., 6, 3552-3563.
du Lac, S., Bastiani, M.J. and Goodman, C.S. (1986) Guidance of neuronal growth cones in the grasshopper embryo. II. Recognition of a specific axonal pathway by the aCC neuron, J. Neurosci., 6, 3532-3541.
Durbin, R.M., Burns, R., Moulai, J., Metcalf, P., Freyman, D., Blum, M., Anderson, J.E., Harrison, S.C. and Wiley, D.C. (1986) Protein, Virus and DNA crystallography with a focused imaging proportional counter, Science, 232, 1127-1132.
Edelman, G.M. (1983) Cell adhesion molecules, Science, 219, 450-457.
Gaze, R.M. (1970) The Formation of Nerve Connections, Academic Press, London.
Gerisch, G. (1982) Chemotaxis in Dictyostelium, Ann. Rev. Physiol., 44, 535-552.
Getting, P.A. and Dekin, M.S. (1985) Tritonia swimming: a model system for integration within rhythmic motor systems, in Model Neural Networks and Behaviour (ed. Selverston), Plenum, New York, pp 3-20.
Ghysen, A. and Jansen, R. (1980) Sensory pathways in Drosophila, in Development and Neurobiology of Drosophila, Siddiqi, O., Babu, P., Hall, L. and Hall, J. (eds.), 247-365, Plenum, New York.
Goldschmidt, R. (1908) Das nervensystem von Ascaris lumbricoides und megalocephala, Zeitshr. Wiss. Zool., 90, 76-136.
Goodman, C.S., Raper, J.A., Ho, R. K. and Chang, S. (1982) Pathfinding by neuronal growth cones during grasshopper embryogenesis, Symp. Soc Dev. Biol., 40, 275-316.
Greenwald, I. (1985b) lin-12, a nematode homeotic gene, is homologous to a set of mammalian proteins that includes epidermal growth factor, Cell, 43, 583-590.
Gundersen, R.W. and Barrett, J.N. (1980) Characterisation of the turning response of dorsal root neurites toward nerve growth factor, J. Cell Biol., 87, 546-554. 1079-1080.
Hamburger, V. (1981) Historical landmarks in neurogenesis, Trends Neurosci., 4, 151-154.
Harrelson, A.L., Bastiani, M.J., Snow, P.M. and Goodman, C.S. (1986) Cell surface glycoproteins expressed on subsets of axon pathways during embryonic development of the grasshopper, Soc. Neurosci. Abstr., 12, 195.
Harris W.A. (1986) Homing behaviour of axons in the embryonic vertebrate brain, Nature, 320, 266-269.
Harrison, R.G. (1910) The outgrowth of the nerve fibre as a mode of protoplasmic movement, J. Exp. Zool., 9, 787-846.
Haydon, P.G., McCobb, D.P. and Kater, S.B. (1984) Serotonin selectively inhibits growth cone motility and synaptogenesis of specific identified neurons, Science, 226, 561-564.
Hedgecock, E. (1985) Cell lineage mutants in the nematode Caenorhabditis elegans, Trends Neurosci., 8, 288-293.
Hedgecock, E.M., Culotti, J.G., Thomson, J.N. and Perkins, L.A. (1985) Axonal guidance mutants of Caenorhabditis elegans identifed by filling sensory neurons with fluoroscein dyes, De. Biol, 111, 158-170.
Ho, R.K. and Goodman, C.S. (1982) Peripheral pathways are pioneered by an array of central and peripheral neurones in grasshopper embryos, Nature, 297, 404-406.
Honig, M.G., Lance-Jones, C. and Landmesser, L. (1986) The development of sensory projection patterns in embryonic chick hindlimb under experimental conditions,Developmental Biology, 118, 511-531.
Jan Y.N., Ghysen, A., Christoph, I., Barbel, S. and Jan, L.Y. (1985) Formation of neuronal pathways in the imaginal discs of Dropiphila melanogaster, 5, 2453-2464.
Johnson, C.D. and Stretton A.O. (1987) submitted.
Kapfhammer, J.P., Grunewald, B.E. and Raper, J.A. (1986) The selective inhibition of growth cone extension by specific neurites in culture, J. Neurosci., 6, 2527-2534.
Keshishian, H. and Bentley, D. (1983) Embryogenesis of peripheral nerve pathways in grasshopper legs III Development without pioneers, Dev. Biol, 96, 116-124.
Kimble, J. (1981) Alterations in cell lineage following laser ablation of cells in the somatic gonad of Caenorhabditis elegans, Dev. Biol., 70, 396-417.
Kramer, A.P. and Stent, G.S. (1985) Developmental arborization of sensory neurons in the leech Haementeria ghilianii II. Experimentally induced variations in the branching pattern, J. Neurosci., 5, 768-775.
Krayanek, S. and Goldberg, S. (1981) Oriented extracellular channels and axonal guidance in embryonic chick retina, Dev. Biol., 84, 41-50.
Kuwada, J.Y. (1986) Cell recognition by neuronal growth ocnes in a simple vertebrate embryo, Science, 233, 740-746.
Lance-Jones, C. and Landmesser, L. (1981) Pathway selection by embryonic chick motorneurones in an experimentally altered environment, Proc. Roy. Soc. London (Biol.), 214: 19-52.
Landmesser, L. (1984) The development of specific motor pathways in the chick embryo, Trends Neurosci., 7, 336-339.
Landmesser, L. and Honig, M.G. (1986) Altered sensory projections in the chick hind limb following the early removal of motor neurons, Developmental Biology, 118, 511-531.
Lecfort, F. and Bentley, D. (1987) Pathfinding by pioneer neurons in isolatd, opened, and mesoderm-free limb buds of embryonic grasshoppers, Dev. Biol, 119, 466-480.
Lehmann, R, Jiminez, F., Dietrich, U. and Campos-Ortega, J.A. (1983) On the phenotype and development of mutants of early neurogenesis in Drosophila melanogaster, Wilhelm Rou’x Arch., 192, 62-74.
Letourneau, P.C. (1979) Cell-substratum adhesion of neurite growth cones, and its role in neural elongation, Exp. Cell Res., 124, 127-138.
Letourneau, P.C. (1983) Axonal growth and guidance, Trends Neurosci., 6, 451-455.
Lopresti, V., Macagno, E.R. and Levinthal, C. (1973) Structure and development of neuronal connections in isogenic organisms: cellular interactions in the development of the optic lamina of Daphnia, Proc. Nat. Acad. Sci. USA, 70, 433-437.
Lumsden, A.G.S. and Davies, A.M. (1983) Earliest sensory nerve fibres are guided to peripheral targets by attractants other than nerve growth factor, Nature, 306, 786-788.
Lumsden, A.G.S. and Davies, A.M. (1986) Chemotropic effect of specific target epithelium in the developing mammalian nervous system, Nature, 323, 538-539.
Martini E. (1916) Die anatomie der Oxyuris curvula, Zeitschr. Wiss. Zool., 116, 137-554.
McGuire, B.A., Stevens, J.K. and Sterling, P. (1986) Microcircuitry of beta ganglion cells in cat retina, J. Neurosci., 6, 907-918.
MenesiniChen, M.G., Chen, J.S. and Levi-Montalcini, R. (1978) Sympathetic nerve fibres’ ingrowth in the central nervous system of neonatal rodents upon intracerebral NGF injection, Arch. Ital. Biol., 116, 53-84.
Meinertzhagen, I.A. (1985) Serotonin-containing cell charged with growth cone arrests, Nature (News and Views), 313, 348-349.
Miller J.P. and Selverston, A.I. (1985) Neural mechanisms for the production of the lobster pyloric motor pattern, in Model Neural Networks and Behavior (ed. Selverston, A.I.), Plenum, New York, pp 37-48.
Nardi, J.B. (1983) Neuronal pathfinding in developing wings of the moth, Manduca sexta, Dev. Biol., 95, 163-174.
Palka, J. (1982) Genetic manipulation of sensory pathways in Drosophila in Neuronal Development (ed. Spitzer, N.C.), p121, Plenum, New York.
Raper, J.A., Bastiani, M.J. and Goodman, C.S. (1984) Pathfinding by neuronal growth cones in grasshopper embryos. IV. The effects of ablating the A and P axons upon the behaviour of the G growth cone, J. Neurosci., 4, 2329-2345.
Rutishauser, U., Hoffman, S. and Edelman, G.M. (1982) Binding properties of a cell adhesion molecule from neural tissue, Proc. Nat. Acad. Sci. USA, 79, 685-689.
Schierenberg, E. (1978) PhD Thesis, University of Gottingen, Germany.
Scholes, J.H. (1979) Nerve fibre topography in the retinal projection to the tectum, Nature, 278, 620-624.
Seber, G.A.F. (1984) Multivariate Analysis, Wiley, New York.
Selverston, A.I. (ed.) (1985) Model Neural Networks and Behavior, Penum, New York.
Silver, J. and Osawa, M.Y. (1983) Postnatally induced formation of the corpus callosum in acallosal mice on glia-coated cellulose bridges, Science, 220, 1067-1079.
Silver, J. and Rutishauser, U. (1984) Guidance of optic axons in vivo by a preformed adhesive pathway on neuroepithelial endfeet, Dev. Biol., 106, 485-499.
Singer, M., Nordlander, R.H. and Egar, M. (1979) Axonal guidance during embryogenesis and regeneration in the spinal cord of the newt. The blueprint hypothesis of neuronal pathway patterning, J. Comp. Neurol., 185, 1-22.
Sperry, R.W. (1963) Chemoaffinity in the orderly growth of nerve fibre patterns and projections, Proc. Nat. Acad. Sci., 50, 707-709.
Sterling, P. (1983) Microcircuitry of the cat retina, Ann. Rev. Neurosci., 6, 149-185.
Sternberg, P.W. and Horvitz, H.R. (1984) The genetic control of cell lineage during nematode development, A. Rev. Genet., 18, 489-524.
Stretton, A.O., Davis, R.E., Angstadt, J.D, Donmoyer, J.E. and Johnson, C.D. (1981) Neural control of behviour in Ascaris, Trends Neurosci., 8, 294-300.
Sulston, J.E. (1983) Neuronal cell lineages in the nematode Caenorhabditis elegans, Cold Spring Harbor Symp. Quant. Biol., 48, 433-452.
Sulston, J.E. and Horvitz, H.R. (1977) Post-embryonic cell lineages of the nematode, Caenorhabditis elegans, Dev. Biol., 56, 110-156.
Sulston, J.E., Schierenberg, E., White, J.G. and Thomson, J.N. (1985) The embryonic cell lineage of the nematode Caenorhabditis elegans, Dev. Biol., 100, 64-119.
Sulston, J.E. and White, J.G. (1980) Regulation and cell autonomy during postembryonic development of Caenorhabditis elegans, Dev. Biol., 78, 577-597.
Summerbell, D., and Stirling, R.V. (1981) The innervation of dorsoventrally reversed chick wings: evidence that motor axons do not actively seek out their appropriate targets, J. Embryol. Exp. Morph., 61, 233-247.
Thomas, J.B. and Wyman, R.J. (1982) A mutation in Drosophila alters normal connectivity between two identified neurons, Nature, 298, 650-652.
Van Essen, D.C. (1979) Visual areas of the mammalian cerebral cortex, Ann. Rev. Neurosci., 2, 227-263.
Ward, S., Thomson, J.N., White, J.G. and Brenner, S. (1975) Electron microscopal reconstruction of the anterior sensory anatomy of the nematode Caenorhabditis elegans, J. Comp. Neurol., 160, 313-338.
White, J.G., Southgate, E., Thomson, J.N. and Brenner, S. (1976) The structure of the ventral nerve cord of Caenorhabditis elegans, Phil. Trans. Roy. Soc. London Ser. B, 327-348.
White, J.G., Southgate, E. Thomson, J.N and Brenner, S. (1983) Factors that determine connectivity in the nervous system of Caenorhabditis elegans, Cold Spring Harbor Symp. Quant. Biol., 48, 633-640.
White, J.G., Southgate, E., Thomson, J.N. and Brenner, S. (1986) The structure of the nervous system of the nematode Caenorhabditis elegans, Phil. Trans. Roy. Soc. London Ser. B, 314, 1-340.
Willshaw, D.J. and von der Malsburg, C. (1979) A marker induction mechanism for the establishment of ordered neural mappings: its application to the retinotectal problem, Phil. Trans. Roy. Soc. London, Ser. B, 203-343.
Wolf, N., Priess, J. and Hirsh, D. (1983) Segregation of germline granules in early embryos of Caenorhabditis elegans: an electron microscopic analysis, J. Embryol. Exp. Morphol., 297-306.
Wolpert, L (1971) Positional information and pattern formation, Curr. Topics Dev. Biol., 183-224.
|